Introduction
With the increase in complexities of the organization and rapid increase in generation of data, organisations are looking for options that can help them in streamlining the data with organization goals and objectives. As the volume of the data is increasing day by day, the traditional methods that were used for managing and manipulating the data are becoming obsolete in nature.
In order to make advent use of this huge volume of data, the new and advance technologies are widely used by the business organisations. The data extraction and manipulation is a series of steps that is undertaken to get the meaningful insights from the data. As data is becoming the new oil of the generation, it is becoming very important to use correct data management and manipulation techniques that can help the business organisation in taking effective decisions out of it. It is very important to hardness the usefulness of data as it can help in analysing the needs and requirements of the customers that can help in providing them better production services in a longer period of time.
There are different types of stages that are involved in the process of data exploration, data preparation and data presentation that helps business organisation to take more effective and accurate decisions that can help them in out beating the competition.
In this task, the central point of discussion would be on understanding the provided data which deals with understanding different attributes of property e which includes around 3000 rows and columns and have 22 main attributes on which data preparation needs to be done. For the process of data exploration MS Excel is going to be used and in order to provide meaningful insights Knime data modelling and data mining tool is going to be used. The later section of the report is also going to provide some suggestions that can help in better data understanding and manipulation that can be used for effective decision making.
1A INITIAL DATA EXPLORATION
1
Data exploration is the elementary step that helps in developing a understanding about the data on which different models and analytics practices is going to be performed. As a provider data set has 3,000 rows and columns, in order to get meaningful insights and easy analytics we have reduced the data size to 500 entries.

The provided screenshot is showing the glimpse of data that has been taken into consideration to do data exploration and analytics for better decision making and analysis.
In order to understand the type of data attributes that were provided in the data set the following table has been formulated which comprises of all 22 data attributes.
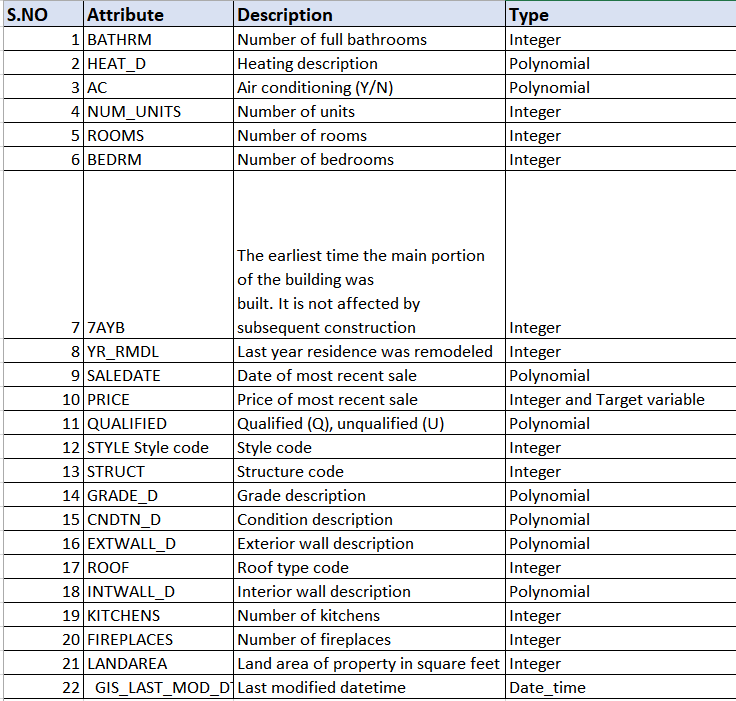
The provided table helps in understanding the type of attributes that the data set comprises of. There are 22 data attributes which are classified different types like polynomial attributes, integer attribute, and target attribute, date time attribute etc.
Integer attributes are the attributes that helps in identifying and representing the data into a numeric form like 1, 2,3 etc.
Polynomial attributes of the attributes which have more than 3 values in it and target attribute is the attribute on which the final modelling is going to be done based on other dependent variables.
2
In this part of the task, I am going to provide data exploration with the use of different visualization techniques that can help in understanding the frequenciesof different data attributes that are playing a crucial role in determining the price of a property. These data attributes are normalised and cleaned with the use of data elimination technique which helps in reducing the size of data and also removing the null entries from the provided data set. Some of the visualisations that can help in understanding the frequencies, location, spread etc. are provided as follows:
| 1 | PRICE | Price of the property | Label |

Price attribute is the target attribute on which the data modelling and analytics is going to be done the histogram is showing the frequency of price which can be easily understandable from this. The maximum price of a property is is 283 4050 where is the average price of a properties 493 607 and standard deviation of a property can be up to 48 1652.
| 2 | BATHRM | Number of bathroom | Integer |
the next attribute that is taken into consideration in order to understand the frequency and spread is number of bathroom which is presented in teacher form. From the provided graph it can be easily analysed that most of the properties that are provided in the greater set comprises of two bathrooms and the least number of bathrooms that are provided in the data set is 5.the average number of bathrooms that the property holds is 2.05 where is the standard deviation is .914.
| 2 | HEAT_D | Heating description | Polynomial |

After analysing the basic statistics of number of bathroom the next attribute that comes into the picture is heating description which is polynomial in nature. From the provided sweaters visualisation it can be easily analyse that most of the properties tend to have hot water radiators. The least number of of heating description is water base and maximum is hot water red which comprises of 199 units from a distribution of 500 samples.
| 3 | AC | Air conditioning (Y/N) | Polynomial |

The next attribute that is taken into consideration is type of air conditioning into the houses and properties.it helps in understanding the availability of air conditioning facility in the houses which states that most of the houses have a conditioning facilities whereas only 135 properties have no air conditioning facilities. Out of the 500 properties 368 properties have air conditioning facilities with them.
| 4 | NUM_UNITS | Number of units | Integer |

The next attribute that is taken into consideration is number of units that a property holds with it from the above presented visualisation it can be easily analysed that the maximum number of unit is 4 where is minimum number is one which makes average number of units to the standard deviation of number of unit is 0.65 which is less than 1 and least count too.
| 5 | ROOMS | Number of rooms | Integer |

The another important factor in determining the price of a property is number of rooms that the property holds.from the provided set of visualisation it can be easily analysed that most of the property have rooms between 7. The least count from the data is 3 where is the maximum count is 18 and the average number of rooms that property holds is it can be easily set from this type of data analysisit can be easily set from this type of data analysis that people tend to like properties with highest number of rooms s out of 500 data samples most of the the properties rooms more than 7 in number.
| 6 | BEDRM | Number of bedrooms | Integer |
The next attribute that is taken into consideration in order to understand the frequencies and spread in the overall data is number of bedrooms that a property holds.
From the provided set of visualisation it can be easily analysed that in most of the properties the highest number of bedrooms is 3.the least number of that property hold is one where is the maximum number of bedrooms that a property old is 9 which makes average of 3.2 7 which states that the average number of rooms that are mostly likely to have is 3.27.
3
In this part of the task, the central Idea behind conducting this task is to understand the outliers in the data set and perform clustering analysis and find out some interesting variables or attributes that are playing a vital role apart from the ones discussed below.
Clustering
Clustering analysis the type of analysis that helps in making group of homogeneous data from heterogeneous data. In order to understand it let’s take a example of of students in a school. There are students with different ages and subjects.in order to cluster them based on their intelligence students are classified on the basis of intelligent, average and poor. It is a method of of forming groups on the basis of similar nature and features. Industry data analysis part we have used k-means clustering model in order to understand the clustering part.
K MEANS model

The provided cluster model helps in understanding the process of clustering on the provided data set. There are three clusters which are cluster 0, cluster 1 and cluster 2.150 items from the data set has been taken into consideration to form groups based on similar nature and features. Cluster 0 comprises of 50 items, cluster 1 comprises of 39 items and cluster 2 comprises of 61 items.cluster to is the cluster which is comprising of highest number of values as these variables are most similar in nature.

The provided visualisation can be used in order to understand the clustering analysis performed on the data set. It can be easily analysed that clustered to comprises of higher number of values as compared to cluster 0 and cluster 1.
Outlier detection
The next time that is taken into consideration is outlier detection. Outlier detection is a process that helps in detecting some value attribute that is not fitting with the model and can be treated as a exceptional in the overall data set and data modelling process. In order to conduct outlier detection the following process is taken into consideration:
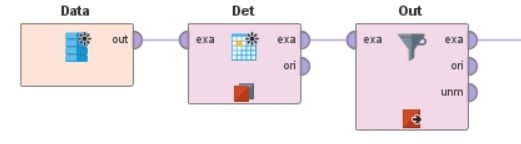
The provided visualisation is showing the process that is taken into consideration to conduct outlier detection process in Knime. The first thing that is taken into consideration to conduct the process is retrieving the data set, applying the outlier operator and applying the outlier detection model and applying it with the output.

The provided line graph visualisation is used to understand the spreading of outlier over the data set.
1B DATA PROCESSING
In this stage of the task,we are going to take into consideration different data processing techniques that can help in understanding the data in a more effective and balanced manner. We are going to use binary technique, binning technique, normalisation technique etc.
The first process that is going to be covered is winning technique with the use of data modelling tool.
1 Binning
Binning technique is a technique which is used for forming different beans or groups of data based on similar characteristics and features.

The above provided diagram can be used for understanding the process that is taken into consideration to conduct meaning process on the provided data set. The process starts with retrieving the data which is named as retrieve sample one data.after the retrieval process is complete the next thing that comes into the picture is discretizing the data that includes the formulation of bins, extraction of data, application of model and connecting it with the final output connector.

The provided table can be used for understanding the beans that helps in understanding the outliers too. These are provided in form of true and false.

The following set of visualisation is obtained after performing the binning process on the data set.
2 Normalization
In this part of the task we are going to perform normalization process.

The above presented process helps in understanding the process of normalisation that is taken under consideration in order to conduct normalisation.in this process the data is retrieved from the repository and normalise operator is used.
The above provided table showing the results of normalisation which includes the frequency and stating that no values were missing during the process of normalisation.
3 Binarise
Binarizing is a process that deals with binarizing the results in form of 0 and 1.In order to conduct binarization process it is required to use one2many operator that can help in binarizing the results.

The provided table is showing the final attributes and prediction done for the pricing attribute.

The provided visualisation of scatter plot is showing the data that is converted into binary form 0 and 1. The blue dots shows zeros and green dot shows one.
1C SUMMARY
In order to provide the summary of the data set it is very important to provide some of the important glimpses that have been taken from the data set. The provided data set was balance data set that comprises of different types of attributes and are huge number of letters that can help in reaching a decision easily. The data service comprising of different factors that were taken into consideration while purchasing or selling of a property and there are different factors that define the price of a property too.
The most important factor that plays a crucial role in defining the price of a property is the size of land and area in which the property is located. The price of property keeps on fluctuating is the demand and supply for property keeps on changing. The other important factor that plays a vital role in defining the price of of a property is is great description, condition description, number of rooms, number of bedrooms, air conditioning units and number of kitchens.
The property that are in small in size are recommended by the buyers to nucleus ise family where there are few members in a family where is the properties which have high number of rooms and bedrooms and recommended to large science family and people who want to live a lavish lifestyle with high number of rooms and facilities.
With the use of data mining and data exploration techniques we were able to understand the different frequency attributes and the nature of attribute that can play dependent or independent role in defining the price of property.
The number of years in last modified date of a property is also a important factor that helps in defining the price of a property.With the help of this task and case study analysis I come to know about the different types of process is better part of data exploration and preprocessing part with the help of different data mining and data exploration tools like with the use of Knime and MS Excel.
My name is one of the most widely used Data analytics tools that help in providing the hidden trends and insights of the data that can be further used for better decision making. With the help of data exploration process I was able to understand the type of attributes that the data comprises of of that helps me in understanding the data in a better way.the data structure in data modelling process is another important factor that I learnt throughout this process that helped me in covering the the different task and activity as per the requirement of the data. The analytics that were performed on price attribute help me in understanding the different processes that needs to be undertaken in order to define the role and predictions on an attribute.
At the end I would like to close my case by providing some insights which says that the price of property is highly fluctuating in nature and there are different attributes that plays a vital role in defining the overall price of a property.
Conclusion
After closely analysing and going to the provided data set, it can be easily said and concluded that, it is very important to have a clear understanding of data without it it is impossible to do further processing on it .Data exploration is one of the basic steps that helps in understanding the different attributes of data on which Data analytics and manipulation can be done in order to provide meaningful insights and visualisation, that can be used for the decision making by the top management. Data exploration is the essence of data manipulation technique that helps in providing better understanding about the data that can you help the data analyst and data scientist to build effective models on it.
after going to effective date of exploration process the next thing that comes into the picture is data preprocessing stage which deals with removing the unwanted attribute from the data and keeping the required attributes that can be used for developing models and analytics on top of it.in the provided case the most important attribute that was taken into consideration for developing model was price attribute that can be used for analysing the price of different properties provided in the theatre set. After going through a number of processes and looking for options that can be used for data preprocessing and manipulation like rapid miner studio, orange, knime etc., it was decided to go with Knime analytics as it provides great user interface and is easy to use.
At the end, it can be easily analysed that with the humongous amount of data organisations are looking forward for having effective tools and professionals who would be able to manage and understand the data that can be useful for the decision making and analytics that can help in beating the competition and surviving in the market for a longer period of time.
References
Akiyama, K., Alberdi, A., Alef, W., Asada, K., Azulay, R., Baczko, A.K., Ball, D., Baloković, M., Barrett, J., Bintley, D. and Blackburn, L., 2019. First m87 event horizon telescope results. iii. data processing and calibration. The Astrophysical Journal Letters, 875(1), p.L3.
Dimitriadou, K., Papaemmanouil, O. and Diao, Y., 2016. AIDE: an active learning-based approach for interactive data exploration. IEEE Transactions on Knowledge and Data Engineering, 28(11), pp.2842-2856.
Dinh, T.T.A., Liu, R., Zhang, M., Chen, G., Ooi, B.C. and Wang, J., 2018. Untangling blockchain: A data processing view of blockchain systems. IEEE Transactions on Knowledge and Data Engineering, 30(7), pp.1366-1385.
Dirac, L.P., Brueckner, M. and Herbrich, R., Amazon Technologies Inc, 2017. Concurrent binning of machine learning data. U.S. Patent 9,672,474.
Henckaerts, R., Antonio, K., Clijsters, M. and Verbelen, R., 2018. A data driven binning strategy for the construction of insurance tariff classes. Scandinavian Actuarial Journal, 2018(8), pp.681-705.
Jeong, Y., Lee, J., Moon, J., Shin, J.H. and Lu, W.D., 2018. K-means data clustering with memristor networks. Nano letters, 18(7), pp.4447-4453.
Knuth, K.H., 2019. Optimal data-based binning for histograms and histogram-based probability density models. Digital Signal Processing, 95, p.102581.
van Leeuwen, J., Smeets, J.B. and Belopolsky, A.V., 2019. Forget binning and get SMART: Getting more out of the time-course of response data. Attention, Perception, & Psychophysics, 81(8), pp.2956-2967.
Xiong, J., Ren, J., Chen, L., Yao, Z., Lin, M., Wu, D. and Niu, B., 2018. Enhancing privacy and availability for data clustering in intelligent electrical service of IoT. IEEE Internet of Things Journal, 6(2), pp.1530-1540.
Zaharia, M., Xin, R.S., Wendell, P., Das, T., Armbrust, M., Dave, A., Meng, X., Rosen, J., Venkataraman, S., Franklin, M.J. and Ghodsi, A., 2016. Apache spark: a unified engine for big data processing. Communications of the ACM, 59(11), pp.56-65.
Zhao, Z., De Stefani, L., Zgraggen, E., Binnig, C., Upfal, E. and Kraska, T., 2017, May. Controlling false discoveries during interactive data exploration. In Proceedings of the 2017 ACM International Conference on Management of Data (pp. 527-540).
Zhou, Q.Y., Park, J. and Koltun, V., 2018. Open3D: A modern library for 3D data processing. arXiv preprint arXiv:1801.09847.
Choe, E.K., Lee, B., Zhu, H., Riche, N.H. and Baur, D., 2017, May. Understanding self-reflection: how people reflect on personal data through visual data exploration. In Proceedings of the 11th EAI International Conference on Pervasive Computing Technologies for Healthcare (pp. 173-182).
Bar El, O., Milo, T. and Somech, A., 2020, June. Automatically generating data exploration sessions using deep reinforcement learning. In Proceedings of the 2020 ACM SIGMOD International Conference on Management of Data (pp. 1527-1537).
Appendix