Answer 1
(a). Arrange the data of 20 student’s result
| Student number |
Results |
| 1 |
42 |
| 2 |
53 |
| 3 |
54 |
| 4 |
61 |
| 5 |
61 |
| 6 |
61 |
| 7 |
62 |
| 8 |
63 |
| 9 |
64 |
| 10 |
66 |
| 11 |
67 |
| 12 |
67 |
| 13 |
68 |
| 14 |
69 |
| 15 |
71 |
| 16 |
71 |
| 17 |
76 |
| 18 |
78 |
| 19 |
81 |
| 20 |
83 |
| Total |
1318 |
Data has arranged in ascending order for getting correct results.
- Compute Mean, Median and Mode
To calculate mean , following formula will implement:

Σ xi /9Total of marks) =1318; n (number of students)=20
131820= 65.9 is the mean value of student’s results.
Median calculation
Median = N2+1=202+1=11th Item of the above table will be median
Median is 67
- Compute 1st and 3rd Quartile
1st Quartile = 14 N+1 = 20+1/4 = 5th Item = 61
3rd Quartile =34N+1=3420+1=634=15th item=71
- Compute and Intercept 90th Percentile
Formula = 90% of total number of students(observation) = 0.90*20 = 18th Item = 78
(b) Inferential Statistics:
Inferential statistics include select sample from the available observation, in order to identify or solve the issue through applying appropriate tests. These tests are also helpful in hypothesis testing and prove the outcome with valid numbers.
Answer 2
(i) Prepare Joint Probability Table
| |
Applied for More than 1 University |
| Age Group |
Yes |
|
No |
|
| 23 and Under |
207 |
207/808*100=25.62% |
201 |
201/1210*100=16.61% |
| 24-26 |
299 |
299/808*100=37.0% |
379 |
379/1210*100=31.32% |
| 27-30 |
185 |
185/808*100 = 22.90% |
268 |
268/1210*100=22.15% |
| 31-35 |
66 |
66/808*100=8.17% |
193 |
193/1210*100= 15.95% |
| 36 and over |
51 |
51/808*100=6.31% |
169 |
169/1210*100= 13.97% |
| Total / Joint Probability(%) |
808 |
100% |
1210 |
100% |
(ii) Given that a student applied to more than 1 university, what is the probability that the student is 24-26 years old.
Probability of student is 24-26 years old = 299/808 =37.00%
- Is the number of universities applied to independent of student age? Explain
Student age is an independent variable against number of observation collected for application made for enrolment in more than one university at a time. Any student at any age can take enrolment of in more than one university or they can adopt only one university at a time.
(b)
Information provided-
| x |
f(x) |
| 10 |
0.05 |
| 20 |
0.1 |
| 30 |
0.1 |
| 40 |
0.2 |
| 50 |
0.35 |
| 60 |
0.2 |
| Total |
|
X represent number of new clients for counselling cases in the year 2021.
Formula of calculating Expected value = ?(?) = ? = ∑? ∗ ?(?)
| x |
f(x) |
(? − ?) 2 |
|
(? − ?) 2*f(x) |
| 10 |
0.05 |
-33 |
1089 |
54.45 |
| 20 |
0.1 |
-23 |
529 |
52.9 |
| 30 |
0.1 |
-13 |
169 |
16.9 |
| 40 |
0.2 |
-3 |
9 |
1.8 |
| 50 |
0.35 |
7 |
49 |
17.15 |
| 60 |
0.2 |
17 |
289 |
57.8 |
| Total |
|
|
|
201 |
Expected Value= (10*0.05+20*0.1+30*0.1+40*0.2+50*0.35+60*0.2) =43
Formula of Variance of a discrete random variable ???(?) = ∑(? − ?) 2 ?(?)
Variance = 201 (calculation shows in table)
Answer 3
- Formulate Hypothesis :
Problem statement: Population annual expenditure on prescription drugs per person is lower in the Midwest than the Northeast.
Hypothesis Statement:
Ho: µ ≤ $838 or
Ho: µ = $838
Ha: µ > $838
Problem statement can test on one tail test from left tail as it requires testing of lower limit.
One (Left) tail test
Formula:

- Calculate value of relevant test statistics and P- value
Sample Mean (x) = $745
Null Hypothesis Mean = $838
SD = 300
Sample size = 60
Applying Formula (745-838)/300/sqrt(n)
Z= -93/38.75 = -2.40
From the table given of Z score , at significance level of 0.05 ,
P value = 0.0071
- Based on the p value in part (III), at 99% confidence level, decide the decision criteria.
If the confidence level is 99% then there is 1% of significance level for this problem and at this level the critical value is 2.326 , for this Z-score is -2.4 which is less than critical value (2.326> -2.4). Null hypothesis shall be rejected.
- Make the conclusion Based on the analysis.
As per rejection of null hypothesis, it is concluded that the prescribed drugs expenditure is not lower in Midwest as comparison to Northwest.
Answer 4
- State the null and alternative hypothesis for single factor ANOVA to test for any significant difference in the mean price of gasoline for the three brands.
Hypothesis
H0 = µ1= µ2= µ3
H1 = µ1≠µ2≠ µ3
(ii) State the decision rule at 5% significance level.
Reject the H0 id t stat > Z critical value, Otherwise accept the null hypothesis
(iii) Calculate the test statistics
| |
A |
B |
C |
| |
3.77 |
3.83 |
3.78 |
| |
3.72 |
3.83 |
3.87 |
| |
3.87 |
3.85 |
3.89 |
| |
3.76 |
3.77 |
3.79 |
| |
3.83 |
3.84 |
3.87 |
| |
3.85 |
3.84 |
3.87 |
| |
3.93 |
4.04 |
3.99 |
| |
3.79 |
3.78 |
3.79 |
| |
3.78 |
3.84 |
3.79 |
| |
3.81 |
3.84 |
3.86 |
| Sample Mean |
3.811 |
3.846 |
3.85 |
| Varience |
0.003349 |
0.004844 |
0.00382 |
ANOVA one- way test Formula
Formula F= MSTR / MSE
MSTR = ???? / ? – 1
MSE = SSE /?r – k
?Ӗ= (3.81 + 3.84 + 3.85)/3 = 3.83
SSTR= 10(3.81- 3.83)2 + 10(3.84-3.83)2 + 10(3.85-3.83)2 = 0.009
MSTR = 0.009/ (3-1) = 0.0045
P-value and critical value approaches
Value of test statistic
SSE = 9(0.003) +9(0.005) + 9(0.004) =0.108
MSE = 0.108/(30-3) = 0.004
F= 0.0045/0.004 =1.125
ANOVA Table
| Source of variation |
Sum of Squares |
Degrees of Freedom |
Mean Square |
F |
P- value |
| Treatment |
0.009 |
2 |
0.0045 |
1.125 |
0.044 |
| Error |
0.108 |
27 |
0.004 |
|
|
| Total |
0.117 |
29 |
0.0085 |
|
|
P- value calculation
Here Numerator df = 2; Denominator Df = 27 then the value of F at 0.01 = 5.49
Decision on the basis of test
The p-value < .05, So null hypothesis shall be rejected
Decision as per critical value approach
Based on an F distribution with 2 numerator d.f. and 27 denominator d.f., F.05 = 3.35.
Reject H0 if F < 3.35
Here F = 1.125 <3.35 which is evidence for rejection of null hypothesis.
(d) Based on the calculated test statistics decide whether any significant difference in the mean price of gasoline for three bands.
The value of F is 1.125 which is lower than F critical value this means hypothesis has been rejected that means there is significant difference in the mean price of gasoline in all the three brands.
Answer 5
- Complete the missing entries from A to H in this output
A= R Square = SSR/SST = 35250755.68/ 42699148.82 = 0.82
B= Observation = 50 (provided in Answer)
C= residual = Total- Regression = 49-2 = 47
D= 42699148.82-7448393.14 = 35250755.68
E= SSRegression / dfreg. = 35250755.68/2 = 17625377.8
F= SSR /(50-3) = 7448393.148/47 = 158476.45
G= 17625377.8/158476.45 = 111.217647
H= Coefficient of income /Standard error of income = 8.36
- Estimate the annual credit card charges for a three-person household with an annual income of $40,000
To estimate charges of credit card , intercept, household value and size has been considered from the ANOVA table.
The annual credit card charges for three person family is $3700 where annual income is $40000.
- Did the estimated regression equation provide a good fit to the data? Explain
No, The reason behind the same is high variability between two variables X and Y which fails in establishing good fit to the data.
Answer 6
- Using linear trend equation forecast the sales of face masks for October 2020
| Month |
Sales ($) |
| 1 |
17000 |
| 2 |
18000 |
| 3 |
19500 |
| 4 |
22000 |
| 5 |
21000 |
| 6 |
23000 |
Linear Trend Equation = Y= Mx+B
M= Y2-Y1X1-X2 = 23000-21000/6-5 = 2000/1 = 2000
Y = Mx+B
Y= ?
X=1
B= 23000
Y = 2000*1+23000
Y = 2000+23000= 25000
$25000 will be the forecasted sale in the month of October.
| |
Sales |
Weight |
Weighted Sale |
| July |
22,000 |
0.2 |
4400 |
| August |
21,000 |
0.3 |
6300 |
| September |
23,000 |
0.5 |
11500 |
| Total |
|
|
22200 |
So, the expected sale for the next month will be $22200
Question 1
Quantitative data are data in graphical form like figures percentages etc using figures the analyst analyzes data and assumes that the calculations can produce an accurate conclusion which can be applied to any wider community. In another hand qualitative analysis examines individual encounters extensively with the goal of defining and interpreting meaning through language narration or visual evidence by creating themes specifically for that group of participants (Kaushik and Mathur, 2014). Qualitative analysis provides knowledge only about the individual cases examined, although theories are often more general assumptions. Quantitative techniques may be used to confirm which of those assumptions is valid.
- The below options are derived from the given question
The type of information mentioned above is variable and the change in the new project of the rail road is the explicit data. As per the measurement scale, it can be see that there are two levels of variable here – which are Yes/ Noand has no specific ranking or order. Hence the measurement scale is nominal.
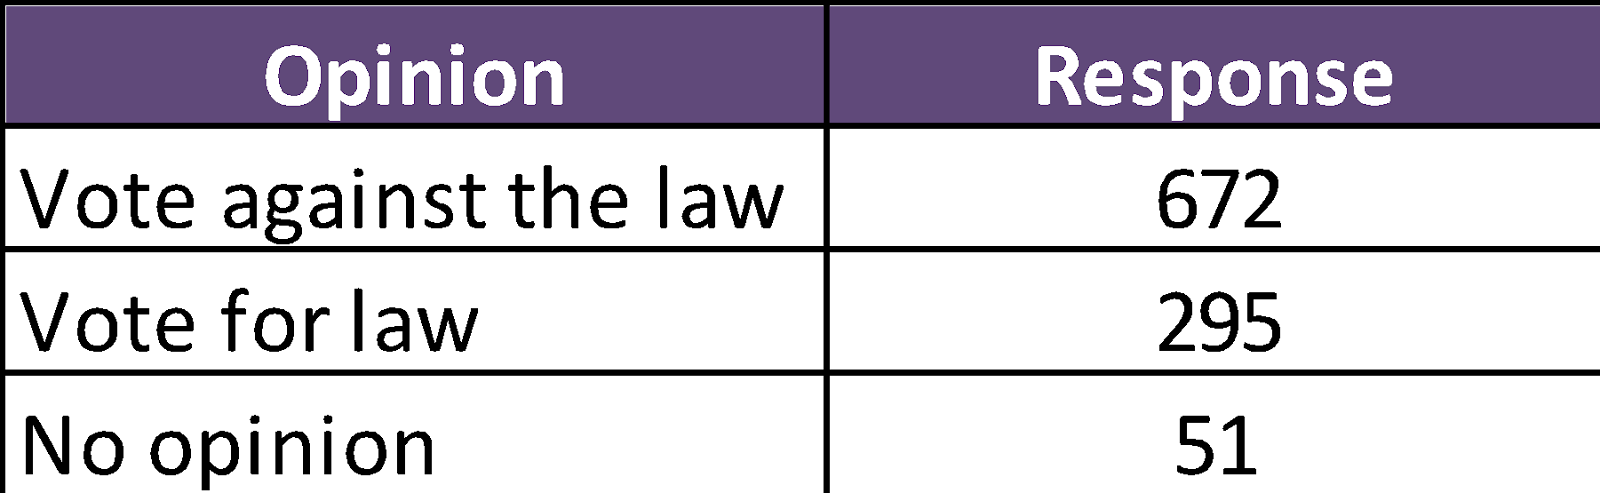
- The graphical presentation mentioned below specifieswhether the general support is in favor oris againstthe increase in the tax development for commencing the new project of rail road. The best presentation for such categories is reflected through a bar chart hence we have used it here.
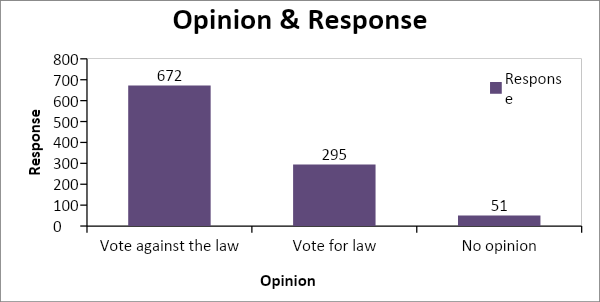
Looking at chart above, it can be seen that maximum amount of votes that are reflecting are not in favor of the law which means that lesspeople are there who are in support of paying thedevelopment tax which is required to start the new project of the rail road.
Question 2
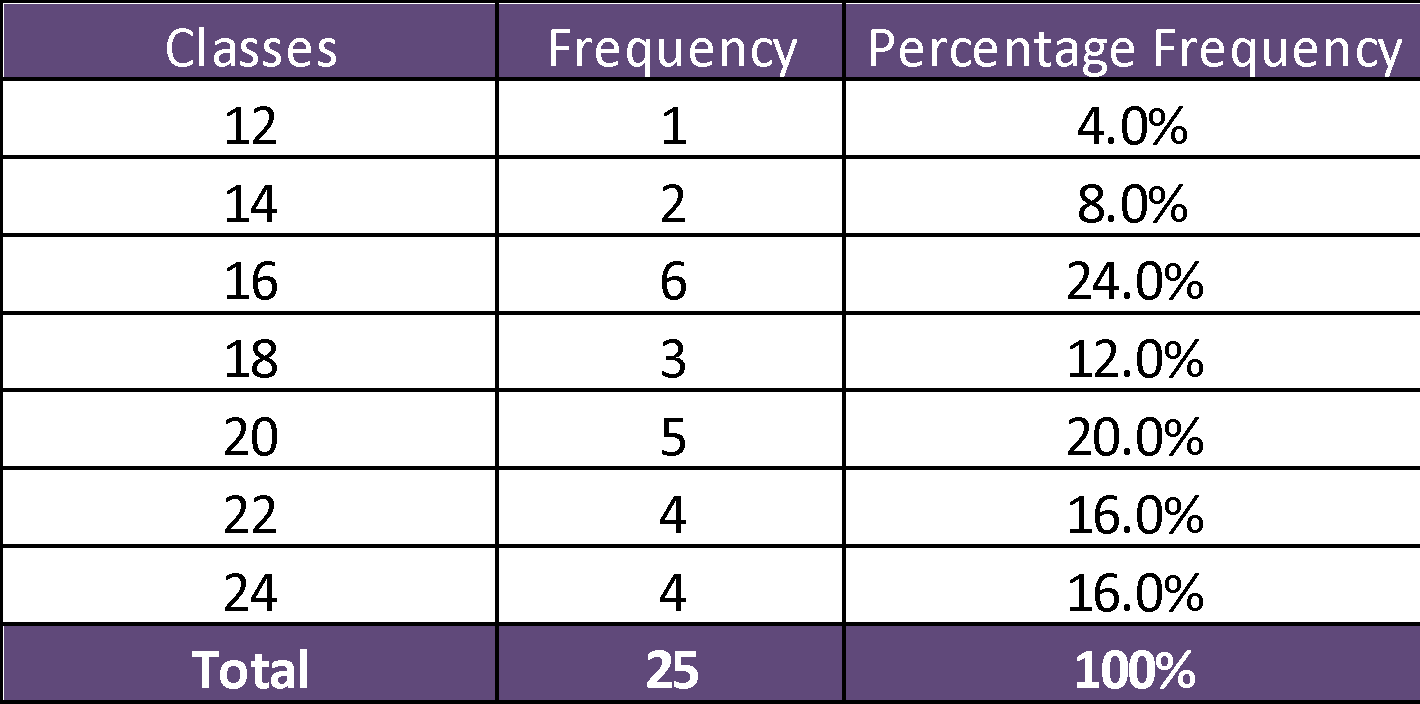
To describe how much time is spent in a weekly meeting data of 25 observations will be used.
- Mention below is the summary of total time spent by 25 CEO in a meeting weekly, time calculated is in hours:

- For preparing the data of frequency distribution along with frequency percentage a two hours class width is used.
Highest value = 23, Lowest value = 12,
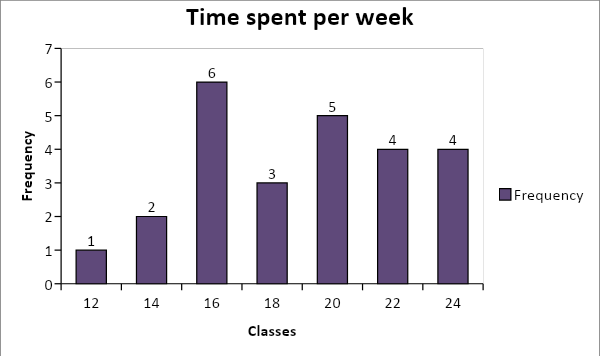
- Mentioned below is the diagram used for calculating time spent by 25 CEOs in weekly meetings. The time is calculated in hours. As per the graphical presentation mention below,it can be seen that mostly the value is falling towards the left side .This shows that the data is tilted negatively.
Question 3
The question in the research that we are going through has multiple methods to collect the data and similarlyfor sampling also there are different methods which can be used. Let us see in the research which is the most suited method for sampling and collection.
- Investigate the voting purpose of the Australian voters in the forthcoming election:
Data collection: Since, many people will be involved the questionnaires method will be appropriate to collect the data as to a certain extent in the sample of large size close ended answers are used.
Definition of Random Sampling: Method in which a sample is taken randomly to draw a conclusion without being bias towards anything is Random Sampling method.
Significance: Any research in which large amount of people or data needs to be investigated, Random sampling is the best method to be used as it’s not possible to investigate the entire lot for drawing a conclusion. Just like in this case it’s not possible to get the views of the entire population of Australia.
Sampling:The random sampling method can be considered for this research, as it would not be possible to travelall of America enquiring each citizen regarding theirchoice. For drawing the concluding we can randomly pick any American citizenand question them.
- Find out reasons for the top 4 banks who are not giving its borrowers the complete interest cuts that the Australian reserve bank has introduced :
Data collection:To collectthis data we can use the interview method, where banking and financial expert can be interview to find out the likelyreasons.
Definition of Convenience sampling: A method in which a sample is taken from people or group who are related to the research and can be approached easily is Convenience sampling method. The only criteria in it are that people should be available and agree to participate.
Significance: In this scenario since the information that has to be gathered is related to banks and only people from banks can provide the inside information, Convenience sampling is the best method that can be used to gather the information as according to this method only those people who are related to the research, have information about it and are easily available to be investigated for drawing conclusion.
Sampling:Convenience sampling is another way to carry out this research. For this objectiveany expert in this field who is easy to approach can be interviewed to find out about the sentiments of the banks (Palinkas,et. al., 2015).
- Comprehend the demographic portfolio of Melbourne community which existat city council of Hume:
Data collection:For understand this; we can do a survey in that area and look for the required details from people residing over there.
Definition of stratified sampling:It is a method in which small groups are made out of the entire population to do the sampling. People having common characteristics are chosen to form a group and from this group samples are taken randomly.
Significance:In this scenario specific information is required from people within the community and to gather such information stratified sampling is best suited as according to this method groups are made of only those people who are within the specified community and share common interest once the group is formed then from within that group samples are take randomly to get to a conclusion.
Sampling: For this research, Stratified sampling method should be used,thatincludespeoplewho have similar characteristics to be gathered into subgroups,so that it becomes easy to know their demographic portfolio.
- Take adults opinionto find out whether use of marijuana in Australiashould be legalized.
Data collection:Focus Group method can be used in this, as views can be taken from the adults on legalizing the use of marijuana in Australia. As the method involves surveying, interviewingand observing the focusedgroup,hence the adult group can be survey, interview and observe here.
Sampling:In this research random sampling method can be implemented,which means taking opinionsof randomadults.
- Evaluatethe standardchildren’sage of Melbourne city :
Data Collection:Records and Documents are what could be used to find out the standard age of the children. These records and documents containreports of the census or something similar which can help in finding the standard age of the children.
Sampling:We can use the Stratified sampling method,according to which children’s date is separated from entire data that contains the completeinformation. That’s the reason Stratified sampling method should be used.
Question 4
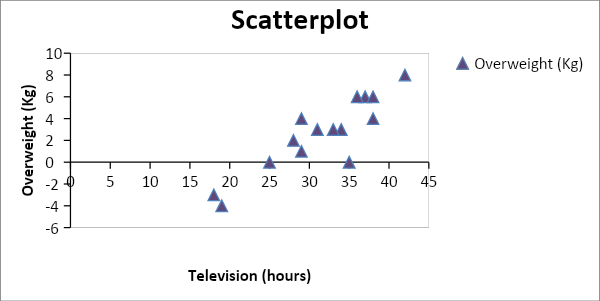
- To find out whether watching television is the cause of increase in weight or not we can use the Scatterplot diagram in which we can layout the connection between spending time in front of the Television and becoming Overweight. In the overweight data negative number will be reflected for any underweight child.
- To calculate correlation coefficient amongst the variables we can use the toolpakof data analysis in excel.

Definition of Correlation coefficient:It is a statistical measureof strength to find out the relationship between relative activities of two variables. The range of the value falls between -1.0 and 1.0. Any number that is calculated and is more than 1.0 or less than -1.0 then the correlation is measured incorrectly. The value comes up as -1.0 then it reflects a negative correlation and if the value come up as 1.0 then it reflects a positive correlation. If the value is 0.0 then it reflect that there is no linear relationship amongst the movement of both the variables.
Correlation coefficient value consist of 0.89119 which means that there is a positive and strong relationship between Overweight (Kg) and television (hours). It meansthat as the hours of watching Television increase, there will be an increase in overweight andvice versa reflecting the relationship amongst the linear changes.
- Regression output in excel is mentioned below:
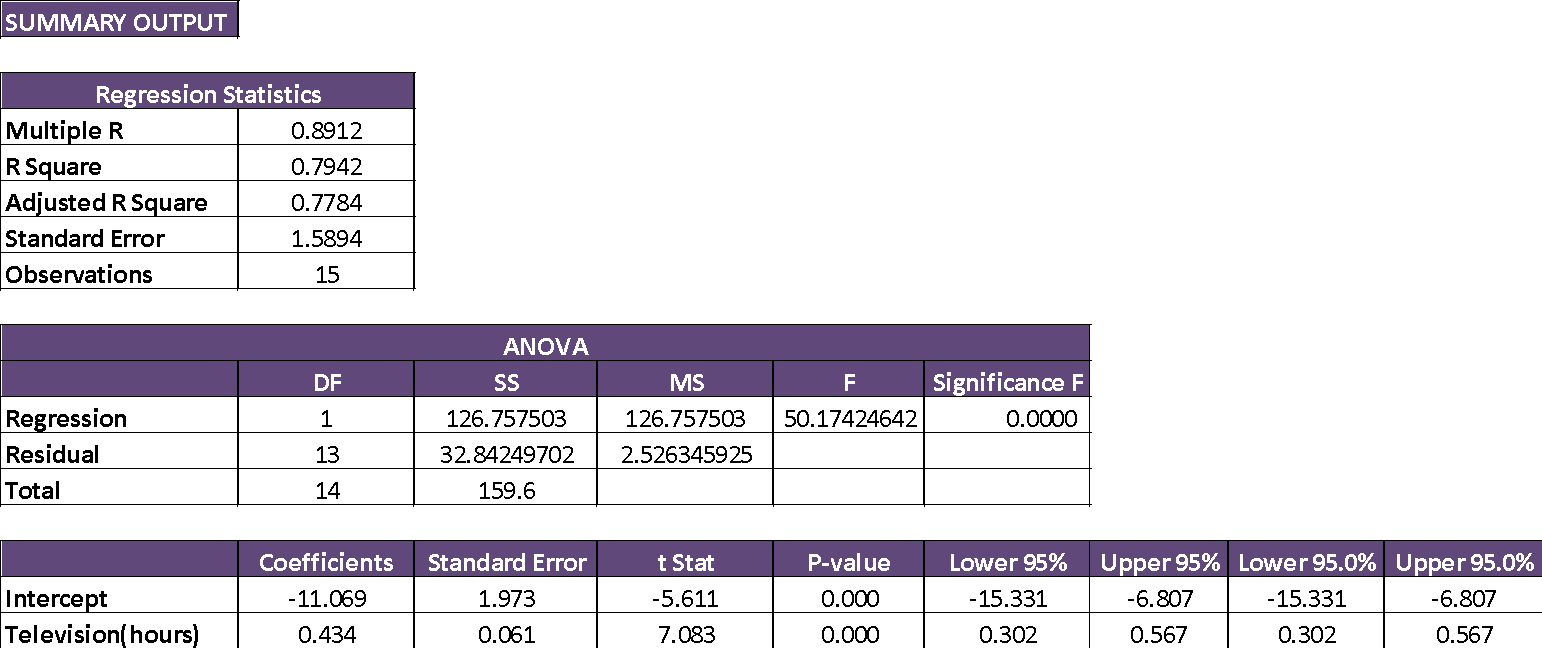
The likely regression equation:
Overweight =-11.069 + 0.434*Television
Explanation:
Intercept: Average Overweight would be expected to go down by (average) 11.0691 if hours of television are zero.
Slope:The overweight will increase by (average) 0.434 Kg if one unit is increased in Television(hours)
- 0.7942 is the coefficient value of determination, whichmeans the variation of 79.42% inoverweight isdescribed by the total hours spent in front of the televisionand hence this is reasonablya model that fits strong.
- As per the outcome of the summary mentioned above, 7.083 is the value of T and 0.000 is the value of P. Since the value of P is not more than 0.05, Variable is significant statistically and hence has a relationship between overweight and television.
- As per the outcome of the summary mentioned above, Standard error value consists of 1.5894. The value of P in the F-stats consists of 0.000. Asthe value of P is not more than 0.05 of significant level, the complete model is significant statistically;also the R-square value is used to determine the model’s fitness. Because 0.7942 is the value which means that this model is a good fit.
Reference:
Kaushik, M. and Mathur, B., 2014. Data analysis of students marks with descriptive statistics. International Journal on Recent and Innovation Trends in Computing and Communication, 2(5), pp.1188-1190.
Kim, T.K., 2017. Understanding one-way ANOVA using conceptual figures. Korean journal of anesthesiology, 70(1), p.22.
Palinkas, L.A., Horwitz, S.M., Green, C.A., Wisdom, J.P., Duan, N. and Hoagwood, K., 2015. Purposeful sampling for qualitative data collection and analysis in mixed method implementation research. Administration and policy in mental health and mental health services research, 42(5), pp.533-544.
Suri, H., 2011. Purposeful sampling in qualitative research synthesis. Qualitative research journal, 11(2), p.63.
Taherdoost, H., 2016. Sampling methods in research methodology; how to choose a sampling technique for research. How to Choose a Sampling Technique for Research (April 10, 2016).