Abstract
Fortescue Metals Group Ltd (FMG) is an iron ore company situated mainly in Australia. It was founded in the year 2003. The company comes under the industry of Metals and Mining. Its headquarters is placed in Perth, Western Australia. Fortescue Metals Group Ltd (FMG) deals in Iron ore, Steel, Gold, Copper and Lithium. It is one of the largest iron ore producers. Mainly fourth largest producer of iron ore in wide world. Elizabeth Gaines works as a (CEO) in the Fortescue Metals Group Ltd and Andrew Forrest being a (Chairman) combines to become the major shareholder in the company. The Fortescue Metals Group Ltd has many subsidiaries work under it. The mine company holds 87000 km2 area. The location where it is situated is Christmas Creek Mine, Pilbara region, West Australia. The company is listed company on the ASX Australia stock exchange with all well known companies. Fortescue Metals Group Ltd (FMG) has grown fastest heavy haul railways, advanced infrastructure and Fortescue company has its own iron ore carriers as well. Fortescue Metals Group Ltd is building a new succes story in the field of mining. Safety, values and empowerment of people are the basic goals, this Australian company holds.
I. Introduction :
The company selected is the fourth largest iron ore producer Fortescue Metals Group Ltd (FMG). The main purpose of my assignment is to research thoroughly through the Fortescue Metals Group Ltd. This purpose is carried so that we can learn about the success policies, financial performance and income statements of the above mentioned company. In this assignment, we will examine the main issues, underlying theories, performance measures used and the firm’s financial performance. We will get to know the capital structure, price earning ratios, non current assets and income statement.
The analyse of Fortescue Metals Group Ltd trends in the last three years. The company’s performance analysis and success report. The company’s philosophies and methodologies about future.
The companies financial ratios show many ups and downs from the last two to three years.The annual reports has been taken from the Fortescue Metals Group Ltd (FMG) official website https://www.fmgl.com.au/. The annual reports will show the progressive approach company took and the successful strategies taken. The assignment has been structured strictly as per the norms and guidelines suggested and the assigned tasks.
This assignment consists the real figures as per the Fortescue Metals Group Ltd website. The referred materials are latest and updated in the year 2019. The assignment consists of many useful information about the success, ups and downs, weaknesses and strengths. Here we will find out the details about the position and liquidity of Fortescue Metals Group Ltd. The share prices are checked on www.asx.com.au.
Financial analysis of fortescue metals group ltd. :
II. Financial Analysis of Selected Company
2.1 The Fortescue Metals Group Ltd company deals in mine industry mainly iron ore –
The Fortescue Metals Group Ltd company deals in Steel, Gold, Copper and Lithium but mainly iron ore. It offers the iron ore to world wide. The importance of the mining in maintaining the comparative advantages of the company can be listed below –
- Trained workers
- Flexible arrangements of work
- Staff incentives plan
- 16 – weeks paid parental leave etc
- Huge Mining sites
- Full check on the safety measures for any miss happenings occur at the time of work.
- Highly automated plants and machinery
All the other personal as well as professional benefits the Fortescue Metals Group Ltd provide to their staff and workers (Babalola & Abiola, 2013).
2.2 Calculation and analysis of performance of Fortescue Metals Group Ltd by liquidity ratios –
According to the data collected from THE WALL STREET JOURNAL, the financial data obtained from current financial statements of Fortescue Metals Group Ltd for the past 3 years we will calculate the liquidity ratios know about the capital structure (Fortescue metals group ltd., 2019).

Assets
| S.No, |
|
Particulars |
2016—17 |
|
2017-18 |
|
2018-19 |
|
| 1 |
Current |
|
|
|
|
|
|
|
| |
|
Current Assets |
$ 222,331.00 |
2.172304295 |
$ 470,047.00 |
2.930668562 |
626006 |
3.047904221 |
| |
|
Current Liabilities |
$ 102,348.00 |
$ 160,389.00 |
205389 |
|
| 2 |
Quick |
|
|
|
|
|
|
|
| |
|
Cash + Accts. Rec. |
$ 193,894.00 |
1.894458123 |
$ 405,946.00 |
2.531008984 |
517553 |
2.519867179 |
| |
|
Current Liabilities |
$ 102,348.00 |
$ 160,389.00 |
205389 |
|
| 3 |
Debt-to-Worth |
|
|
|
|
|
|
|
| |
|
Total Liabilities |
$ 102,448.00 |
0.424246942 |
$ 166,869.00 |
0.300281262 |
205616 |
0.260982365 |
| |
|
Net Worth |
$ 241,482.00 |
$ 555,709.00 |
787854 |
|
| |
|
|
|
|
|
|
|
|
| INCOME STATEMENT RATIOS: Profitability (Earning Power) |
|
|
|
|
|
|
|
|
| 4 |
Gross Margin |
|
|
|
|
|
|
|
| |
|
Gross Profit |
$ 151,006.00 |
0.274932772 |
$ 464,349.00 |
0.503439027 |
713752 |
0.53251722 |
| |
|
Sales |
$ 549,247.00 |
$ 922,354.00 |
1340336 |
|
| 5 |
Net Margin |
|
|
|
|
|
|
|
| |
|
Net Profit Before Tax |
$ 52,299.00 |
0.095219455 |
$ 415,711.00 |
0.450706562 |
283232 |
0.211314178 |
| |
|
Sales |
$ 549,247.00 |
$ 922,354.00 |
1340336 |
|
| |
|
|
|
|
|
|
|
|
| ASSET MANAGEMENT RATIOS: Overall Efficiency Ratios |
|
|
|
|
|
|
|
|
| 6 |
Sales-to-Assets |
|
|
|
|
|
|
|
| |
|
Sales |
$ 549,247.00 |
1.596973221 |
$ 922,354.00 |
1.276476726 |
1340336 |
1.349145923 |
| |
|
Total Assets |
$ 343,930.00 |
$ 722,578.00 |
993470 |
|
| 7 |
Return on Assets |
|
|
|
|
|
|
|
| |
|
Net Profit Before Tax |
$ 52,299.00 |
0.15206292 |
$ 415,711.00 |
0.575316436 |
283232 |
0.285093662 |
| |
|
Total Assets |
$ 343,930.00 |
$ 722,578.00 |
993470 |
|
| 8 |
Return on Investment |
|
|
|
|
|
|
|
| |
|
Net Profit Before Tax |
$ 52,299.00 |
0.15206292 |
$ 415,711.00 |
0.575316436 |
283232 |
0.285093662 |
| |
|
Net Worth |
$ 343,930.00 |
$ 722,578.00 |
993470 |
|
| |
|
|
|
|
|
|
|
|
| ASSET MANAGEMENT RATIOS: Working Capital Cycle Ratios |
|
|
|
|
|
|
|
|
| 9 |
Inventory Turnover |
|
|
|
|
|
|
|
| |
|
Cost of Goods Sold |
$ (285,729.00) |
-10.04778985 |
$ (458,005.00) |
-7.145052339 |
-590584 |
-5.4455294 |
| |
|
Inventory |
$ 28,437.00 |
$ 64,101.00 |
108453 |
|
| 10 |
Inventory Turn-Days |
|
|
|
|
|
|
|
| |
|
360 |
360 |
0.012659563 |
360 |
0.005616137 |
360 |
0.00331941 |
| |
|
Inventory Turnover |
$ 28,437.00 |
$ 64,101.00 |
108453 |
|
| 11 |
Accounts Receivable Turnover |
|
|
|
|
|
|
|
| |
|
Sales |
$ 549,247.00 |
7.536940473 |
$ 922,354.00 |
14.08367562 |
1340336 |
25.41017669 |
| |
|
Accounts Receivable |
$ 72,874.00 |
$ 65,491.00 |
52748 |
|
Commnets
- the current ratio has increased . This means the Fortescue Metals Group Ltd company is able to meet the short term liabilities successfully over the time. There is an increasing trend in the ratios.
- According to the above calculation, it is clear that with the increase in quick ratio Fortescue company can easily pay back its current liabilities. In 2018 the quick ratio was less than 1, this means company was not able to pay back the current liability.
- There is a certain growth in the cash ratio from the year 2017 to year 2019. But these ratios are less than 1. A ratio above 1 means that, the company can easily pay off its current liabilities with the cash and cash equivalent. Here the company have cash ratio less than 1 in all the years.
- According to the above scenario, the Debt Equity Ratio is changing but very minutely. The low Debt Equity Ratio indicates less of borrowed funds and more of owner funds in the company. So here it is a good sign. There is a decreasing trend in the Debt Equity Ratio in passing years (Blum & Dacorogna, 2014).
- As we can see there is a slight decline in the Debt to Total Asset Ratio in all the three years. This can be interpreted as the percentage of assets is funded through borrowing funds as compared with the percentage of principal resources that are funded by investors.
- As we can see from the above proprietary ratios in percentage. here. When proprietary ratios is high that means the company is financially strong. Here it seems the company is dependent on debts in 2017 and 2019. The trend is not regular (Fortescue metals group ltd., 2019).
- Above are the position of liquidity, solvency and trends analysis according to the important accounting ratios of Fortescue Metals Group Ltd.
2.3 Non-current Asset Analysis –
Non Current Assets are Fixed Assets such as Property, Plant, Equipment, Land & Building, Long-term Investment in Bonds and Stocks, Goodwill, Patents, Trademark etc.
| Carrying Amount beg. of the year |
2016-17 |
2017-18 |
2018-19 |
| Plant and equipment |
11456 |
11156 |
10995 |
| Land and buildings |
849 |
796 |
744 |
| Exploration and evaluation |
772 |
813 |
857 |
| Assets under development |
227 |
291 |
301 |
| Development |
3563 |
3437 |
3292 |
| Depreciation |
|
|
|
| Plant and equipment |
4521 |
5478 |
6464 |
| Land and buildings |
257 |
316 |
412 |
| Exploration and evaluation |
0 |
0 |
0 |
| Assets under development |
0 |
0 |
0 |
| Development |
1052 |
1259 |
1448 |
| Carrying Amount end of the year |
|
|
|
| Plant and equipment |
11156 |
10995 |
10690 |
| Land and buildings |
796 |
744 |
650 |
| Exploration and evaluation |
813 |
857 |
539 |
| Assets under development |
291 |
301 |
889 |
| Development |
3437 |
3292 |
3303 |
Here, in the year 2019 the amount of non-current assets has increased as compared to the last two years that is 2018 and 2017. This increase means the Fortescue Metals Group Ltd company can turn their assets in to cash within 1 year as per the date mentioned in companies balance sheet (Fortescue metals group ltd., 2019).
2.4 The scenario analysis as per the information given –
| Averag Price |
$25 |
|
|
|
|
| Units to be sold |
450000 |
|
|
|
|
| Life |
4 years |
|
|
|
|
| Equipmnet Cost |
$2,500,000 |
|
|
|
|
| Residual Value |
$500,000 |
|
|
|
|
| Working Cpaital |
$800,000 |
|
|
|
|
| Variable Cost |
$15 |
|
|
|
|
|
|
|
|
|
|
|
|
|
|
|
|
| NPV |
Current Case |
|
|
|
| Years |
0 |
1 |
2 |
3 |
4 |
| Equipmet Cost |
2500000 |
|
|
|
|
| Sales |
|
11250000 |
11250000 |
11250000 |
11250000 |
| Working Capital |
|
$800,000 |
800000 |
800000 |
800000 |
| Variable Cost |
|
6750000 |
6750000 |
6750000 |
6750000 |
| Residaul Value |
|
|
|
|
$500,000 |
| Cash Fixed Cost |
|
450000 |
450000 |
450000 |
$450,000 |
| Profit Before Tax |
|
$3,250,000 |
$3,250,000 |
$3,250,000 |
$3,250,000 |
| Tax |
|
975000 |
975000 |
975000 |
975000 |
| Profit after Tax |
|
$2,275,000 |
$2,275,000 |
$2,275,000 |
$2,275,000 |
| Discounted Values |
1 |
0.89285714 |
0.79719 |
0.71178 |
0.63552 |
| Discounted Cash Flow |
2500000 |
$2,031,250 |
$1,813,616 |
$1,619,300 |
$1,445,804 |
|
|
|
|
|
|
| Outflow |
2500000 |
|
|
|
|
| Inflow |
6909969.76 |
|
|
|
|
| Net Present Value |
4409969.76 |
|
|
|
|
| Averag Price |
$20 |
|
|
|
|
| Units to be sold |
360000 |
|
|
|
|
| Life |
4 years |
|
|
|
|
| Equipmnet Cost |
$2,500,000 |
|
|
|
|
| Residual Value |
$500,000 |
|
|
|
|
| Working Cpaital |
$800,000 |
|
|
|
|
| Variable Cost |
$18 |
|
|
|
|
|
|
|
|
|
|
|
|
|
|
|
|
| NPV |
Worst Case |
|
|
|
|
| Years |
0 |
1 |
2 |
3 |
4 |
| Equipmet Cost |
2500000 |
|
|
|
|
| Sales |
|
7200000 |
7200000 |
7200000 |
7200000 |
| Working Capital |
|
$800,000 |
800000 |
800000 |
800000 |
| Variable Cost |
|
6480000 |
6480000 |
6480000 |
6480000 |
| Residaul Value |
|
|
|
|
$500,000 |
| Cash Fixed Cost |
|
550000 |
550000 |
550000 |
$550,000 |
| Profit Before Tax |
|
($630,000) |
($630,000) |
($630,000) |
($630,000) |
| Tax |
|
-189000 |
-189000 |
-189000 |
-189000 |
| Profit after Tax |
|
($441,000) |
($441,000) |
($441,000) |
($441,000) |
| Discounted Values |
1 |
0.892857143 |
0.79719 |
0.71178 |
0.63552 |
| Discounted Cash Flow |
2500000 |
($393,750) |
($351,563) |
($313,895) |
($280,263) |
|
|
|
|
|
|
| Outflow |
2500000 |
|
|
|
|
| Inflow |
-1339471.06 |
|
|
|
|
| Net Present Value |
-3839471.06 |
|
|
|
|
| NPV |
Best Case |
|
|
|
|
| Years |
0 |
1 |
2 |
3 |
4 |
| Equipmet Cost |
2500000 |
|
|
|
|
| Sales |
|
16200000 |
16200000 |
16200000 |
16200000 |
| Working Capital |
|
$800,000 |
800000 |
800000 |
800000 |
| Variable Cost |
|
6480000 |
6480000 |
6480000 |
6480000 |
| Residaul Value |
|
|
|
|
$500,000 |
| Cash Fixed Cost |
|
350000 |
350000 |
350000 |
$350,000 |
| Profit Before Tax |
|
$8,570,000 |
$8,570,000 |
$8,570,000 |
$8,570,000 |
| Tax |
|
2571000 |
2571000 |
2571000 |
2571000 |
| Profit after Tax |
|
$5,999,000 |
$5,999,000 |
$5,999,000 |
$5,999,000 |
| Discounted Values |
1 |
0.892857143 |
0.79719 |
0.71178 |
0.63552 |
| Discounted Cash Flow |
2500000 |
$5,356,250 |
$4,782,366 |
$4,269,970 |
$3,812,473 |
|
|
|
|
|
|
| Outflow |
2500000 |
|
|
|
|
| Inflow |
18221058.73 |
|
|
|
|
| Net Present Value |
15721058.73 |
|
|
|
|
Interpretation on the sensitivity
Selling price : 9055951 = .19
450000*35*3.037
Variable Price = 9055951 = .44
450000*15*3.037
Fixed Cost = 9055951 = 6.63
450000*3.037
2.5 The latest share or bond issuance by the fortescue metals group ltd
The Fortescue Metals Group has issued coupon bonds recently. FMG Resources AUG 2006 is the issuer. The company has issued bonds in the form of Registered documentary bonds. It was an open subscription. It is an international bonds (Dorina, et. al., 2012).
The Company has been listing in Australia stock exchange as Fortescue FMG.
2.6 Calculation of the pe ratios and share price movement of the fortescue metals group ltd –
Price earning ratio has been declined to 46% last year in 2018. Up to the year 2019, the price earning ratio has gone up to 40%. The Operating income of the company is A$2.477 Billion in the year 2018 and the Net income results in A$1.134 billion in the year 2018 (Fortescue metals group ltd., 2019).
| Price Earning Ratios = Market price / Earning per share |
|
|
|
| |
2019 |
2018 |
2017 |
| Net income |
4456 |
1,134 |
2,775 |
| Earning pae share |
1.44 |
0.36 |
0.89 |
The present PE ratio of Fortescue Metals Group ltd is 22.5%. If the pe ratio is high, the company is a growth firm and vice versa (Babalola & Abiola, 2013).
The last recorded price of share of FMG was marked at 8.950. The share price movement is watched out as 0.185 2.11% .
Recommendation Letter –
As company took a comprehensive examination and analysed the firm’s financial performance from the updated financial statements of the Fortescue Metals Group Ltd. Being an investment analyst, I would recommend the investor to invest in Fortescue Metals Group Ltd. This company is performing well in the year 2019 and can write many success stories in the upcoming years. The share price fluctuations are not high or low. The investors can gain good returns from Fortescue Metals Group Ltd in near future.
Conclusion
The assignment is done with the fortescue metals group ltd .The company profit statement has been studied to find out the ratios of the company. This is finding that the company had making profits or not. The research will be useful to the shareholders to find whether to invest in the company or not. Thaw Company had made a successful issue of shares whose report had been summarised above. The ratios are done to better understanding of the report. All the current ration and the liquidity ratio are check to find the company had made profits in current year or not. The written down method of depreciation had been followed by the company. The life of the assets and the scarp value is as per the market value and as per the recommendation of law. The calculation of NPV is done to find pout whiter the project should be adopted or not. The company had made all the conclusion of worst and nest case and the sensitivity is done to find out which variable are more sensitive than others.
References
Babalola, Y. A., & Abiola, F. R. (2013). Financial ratio analysis of firms: A tool for decision making. International journal of management sciences, 1(4), 132-137.
Blum, P., & Dacorogna, M. (2014). DFA‐Dynamic Financial Analysis. Wiley StatsRef: Statistics Reference Online.
Christensen, T., Cottrell, D., & Baker, R. (2013). Advanced financial accounting. McGraw-Hill.
Dorina, P., Victoria, B., & Diana, B. (2012). Aspects of company performance analysis based on relevant financial information and nonfinancial information. The Annals of the University of Oradea, 956.
Fortescue metals group ltd. (2019). About us. [Online] Fortescue metals group ltd. Available at https://www.fmgl.com.au/docs/default-source/annual-reporting-suite/fy19-annual-report.pdf. [Accessed on 10.09.2019]
Fortescue metals group ltd. (2019). About us. [Online] Fortescue metals group ltd. Available at https://www.fmgl.com.au/docs/default-source/default-document-library/fy2017-annual-report.pdf [Accessed on 10.09.2019]
Fortescue metals group ltd. (2019). About us. [Online] Fortescue metals group ltd. Available at https://www.fmgl.com.au/investors/asx-announcements# [Accessed on 10.09.2019]
Abstract
Jb Hi Fi Company is founded by John Barbuto. It is a type of retail industry founded 45 years ago in 1974 at Keilor East, Victoria, Australia. This company mainly deals in the products related to customer electronics, major appliances such as domestic appliance for cooking and washing laundry, for food preservation etc and example of small appliances can be said as microwave oven, coffee makers etc. JB Hi Fi is the largest company of home appliances in Australia. It deals in Computers, tablets, mobile phones, TVs and gaming multimedia. The Good Guys is the subsidiary of this company. JB HI FI is located nearly at 303 places including Australia and New Zealand. The headquarters of JB Hi Fi Company is in Tower Two of Vicinity Centre’s Chadstone Shopping Centre, Melbourne, Australia. Gregory Richards being a Chairman of the company and Richard Murray as the CEO forms the two key people of Jb Hi Fi. This company is publically traded in the Australian stock exchange named ASX: JBH. The company ranks 50 out of top 2000 companies running in Australia. All the other relevant information about the company can be referred through the official website of Jb Hi Fi Company https://www.jbhifi.com.au/.
I Introduction
Here we are going to know all about the success policies of JB HI FI. Its financial performance and income statements of the company. Jb Hi Fi is an Australian company, aw we know, one of the largest entertainment retailer of home products. The company deals with major appliances as well as small appliances in a variety of home appliances. Mobile phones, laptops, televisions, gaming microwave ovens, toaster JB Hi Fi are all examples of the company’s flagship and small appliances.
In this assignment, we will go over all the important and salient issues faced by the company in general, their adopted principles, the overall performance measures used, and the performance of the firm’s financial position of JB HI FI Company. We will also analyse the structure of capital, their price to income ratio, non-assets of the company JB hi fi. These performances will set the standards for future targets for the company, will they be able to meet their goals and achieve success in the near future?
We will analyse the changing trends about the Jb Hi Fi Australian Company for the last three year financial ratios of the company. An in-depth study of the company’s performance analysis and success report will be seen. The company’s philosophy and system of work will predict the future. Jb Hi Fi as stated above in this assignment is the real and comparable figures according to the official website of the Australian company. We can get all the necessary information about the company from the company annual report. The referenced material has been updated in the year 2019.
Here we are also going to know the details about the liquidity position of Jb Hi Fi Australian Company. The prices of the shares are updated and regularly assured from the official website of JB HI FI COMPANY https://www.jbhifi.com.au.
II Financial Analysis of selected company
2.1 The key product for Jb Hi Fi Company is electronic household entertainment appliances –
JB Hi Fi Company in Australia deals in household or domestic products, major appliances as well as small appliances. Major appliances such as TVs, laptops are bigger in size and higher in value as compared to small appliances such as coffees machine and microwave oven (Tandon & Malhotra, 2013). The importance of the petroleum products in maintaining the comparative advantages of the company are listed below –
- Safety – The Company properly maintained the safety measures in all the products. Provides healthy and safe working environment for all the employees working in the company. Fair behaviour and strict rules and regulations prevent accidents and ensure safety in the company.
- Diversity – Jb Hi Fi Company has much line of products. They have diverse skills, background, and experience about policies. They are creative and innovative for products. They try to plan and make strategies for creating as well as promotion of the new product.
- Social programs – Company contributes in Helping Hand weekly. Helping hand is the Registered Charitable Trust. This trust has been introduced so that employees donate a limited liability to charity.
- Employee groups – Employee groups are formed for timely awareness and programs relating to the benefits of workplace leadership across Australian businesses.
-
- Complete Disclosure – The director’s focus mainly on the forming up of different strategies and success paths. They want the customers to have the complete disclosure of all the relevant information about the company. Bank, investors, government or the interested parties.
- Risk Identification and Management – The Company conducts the necessary operations for the company to identify the risk and manage between risk and reward.
- E- Waste – All the E- Waste from different stores and operations for the support purposes are recycled. No wastage takes place by the store initiatives. They ensure the impact of wastage on the environment gets reduced with time.
Variable rewards incentives – the reward incentive under the VRP in the case of dishonesty and fraud, the board’s discretion will happen by the clawback. Misstatement of material, breach of material and in some circumstances the board shows negligence (Talari, et. al., 2017). Subject to this, a Group executive will not be eligible to receive VRPaward in respect of performance period.
Note – If, during that period, the executive cease to employed, or has given notice of his or her resignation from employment or has been given notice of termination from employment.
2.2 Identify and conduct a trend analysis with two groups of financial ratios, including liquidity and capital structure of the selected company.
| BALANCE SHEET RATIOS |
|
|
|
|
|
|
|
|
|
|
|
|
|
|
|
|
|
|
| S. No, |
|
Particulars |
2016-17 |
|
2017-18 |
|
2018-19 |
|
| 1 |
Current |
|
|
|
|
|
|
|
|
|
Current Assets |
$ 1,170.70 |
1.321630165 |
$ 1,210.50 |
1.319777584 |
$ 1,276.50 |
1.376874124 |
|
|
Current Liabilities |
$ 885.80 |
$ 917.20 |
$ 927.10 |
| 2 |
Quick |
|
|
|
|
|
|
|
|
|
Cash + Accts. Rec. |
$ 269.40 |
0.304131858 |
$ 276.70 |
0.301679023 |
$ 355.20 |
0.383130191 |
|
|
Current Liabilities |
$ 885.80 |
$ 917.20 |
$ 927.10 |
| 3 |
Debt-to-Worth |
|
|
|
|
|
|
|
|
|
Total Liabilities |
$ 1,598.80 |
0.651959385 |
$ 947.60 |
0.5 |
$ 1,044.10 |
0.5 |
|
0 |
Net Worth |
$ 2,452.30 |
$ 1,895.20 |
$ 2,088.20 |
|
|
|
|
|
|
|
|
|
| INCOME STATEMENT RATIOS: Profitability (Earning Power) |
|
|
|
|
|
|
|
|
| 4 |
Gross Margin |
|
|
|
|
|
|
|
|
|
Gross Profit |
$ 1,230.50 |
0.218638948 |
$ 1,470.10 |
0.214478503 |
$ 1,527.10 |
0.215226981 |
|
|
Sales |
$ 5,628.00 |
$ 6,854.30 |
$ 7,095.30 |
| 5 |
Net Margin |
|
|
|
|
|
|
|
|
|
Net Profit Before Tax |
$ 172.40 |
0.030632552 |
$ 233.20 |
0.034022438 |
$ 249.80 |
0.035206404 |
|
|
Sales |
$ 5,628.00 |
$ 6,854.30 |
$ 7,095.30 |
|
|
|
|
|
|
|
|
|
| ASSET MANAGEMENT RATIOS: Overall Efficiency Ratios |
|
|
|
|
|
|
|
|
| 6 |
Sales-to-Assets |
|
|
|
|
|
|
|
|
|
Sales |
$ 5,628.00 |
2.294988378 |
$ 6,854.30 |
2.723743294 |
$ 7,095.30 |
2.836871776 |
|
|
Total Assets |
$ 2,452.30 |
$ 2,516.50 |
$ 2,501.10 |
| 7 |
Return on Assets |
|
|
|
|
|
|
|
|
|
Net Profit Before Tax |
$ 259.20 |
0.105696693 |
$ 334.50 |
0.13292271 |
$ 358.90 |
0.143496861 |
|
|
Total Assets |
$ 2,452.30 |
$ 2,516.50 |
$ 2,501.10 |
| 8 |
Return on Investment |
|
|
|
|
|
|
|
|
|
Net Profit Before Tax |
$ 259.20 |
0.105696693 |
$ 334.50 |
0.176498523 |
$ 358.90 |
0.17187051 |
|
|
Net Worth |
$ 2,452.30 |
$ 1,895.20 |
$ 2,088.20 |
|
|
|
|
|
|
|
|
|
| ASSET MANAGEMENT RATIOS: Working Capital Cycle Ratios |
|
|
|
|
|
|
|
|
| 9 |
Inventory Turnover |
|
|
|
|
|
|
|
|
|
Cost of Goods Sold |
$ (4,397.50) |
-5.11396674 |
$ (5,384.10) |
-6.042082819 |
$ (5,568.20) |
-6.27968873 |
|
|
Inventory |
$ 859.90 |
$ 891.10 |
$ 886.70 |
| 10 |
Inventory Turn-Days |
|
|
|
|
|
|
|
|
|
360 |
360 |
0.418653332 |
360 |
0.403995062 |
360 |
0.405999774 |
|
|
Inventory Turnover |
$ 859.90 |
$ 891.10 |
$ 886.70 |
| 11 |
Accounts Receivable Turnover |
|
|
|
|
|
|
|
|
|
Sales |
$ 5,628.00 |
28.6266531 |
$ 6,854.30 |
33.48461163 |
$ 7,095.30 |
30.06483051 |
|
|
Accounts Receivable |
$ 196.60 |
$ 204.70 |
$ 236.00 |
Trends:
- Current Ratio is the important ratio of the company. It will show that how company will pay the current liabilities. It is comparatively similar in every year.
- The ratio of liquidity will clear out that the company is viable to pay the liquid liabilities. It should be less than 1. The company is having good liquid ratios, and it is maintained in all the 3 years.
- The ratio of net worth will clear out that at either company assets are justifying with the company equity or not. It should not be overvalued or undervalued. The company is also having similar net worth ratio in all the years.
- The net margin will show the profitability of the company. It will shoe either company is profit making or not (JB HI Fi Group, 2019).
- The return on assets will show that how much of the assets had been utilised. How much profit they are giving.
- All the contribution in equity is from the shareholders, and it also comprises of the retained earnings and reserves.
2.3 Perform a non-current asset analysis
| Carrying Amount end of the year |
2016-17 |
2017-18 |
2018-19 |
| Plant & Equipment |
148.2 |
148.2 |
132.3 |
| Leasehold Improvements |
60 |
60 |
59.2 |
|
|
|
|
| Depreciation |
2016-17 |
2017-18 |
2018-19 |
| Plant & Equipment |
138.5 |
162.4 |
196.3 |
| Leasehold Improvements |
97.3 |
113.9 |
130.2 |
|
|
|
|
| Carrying Amount beg. of the year |
2016-17 |
2017-18 |
2018-19 |
| Plant & Equipment |
114.8 |
148.2 |
148.2 |
| Leasehold Improvements |
61.4 |
60 |
60 |
The fixed assets are consisting of the plant & equipment.
The life of the estimates is as follows:
Leasehold Property: 1 to 15 years
Plant and Equipment: 1.5 to 15 years
The impairment will be done as per the change in circumstances.
2.4 Perform a scenario analysis with data provided
| Average selling price |
$ 25.00 |
|
|
|
| Expected sale |
450000 |
|
|
|
| equipment cost |
$ 2,500,000.00 |
|
|
|
| Residual Value |
$ 500,000.00 |
|
|
|
| Working Capital |
$ 800,000.00 |
|
|
|
| Depreciation |
SLM |
|
|
|
| Variable cost |
$ 15.00 |
|
|
|
| Fixed cost |
$ 450,000.00 |
|
|
|
| Discount rate |
12% |
|
|
|
| Tax Rate |
30% |
|
|
|
|
|
|
|
|
| Year |
1year |
2 year |
3 year |
4 year |
| Sales |
11250000 |
11250000 |
11250000 |
11250000 |
| Variable cost |
6750000 |
6750000 |
6750000 |
6750000 |
| Contribution |
4500000 |
4500000 |
4500000 |
4500000 |
| Fixed cost |
450000 |
450000 |
450000 |
450000 |
| Depreciation |
500000 |
500000 |
500000 |
500000 |
| Operating Profit |
3550000 |
3550000 |
3550000 |
3550000 |
| Tax |
1065000 |
1065000 |
1065000 |
1065000 |
| PAT |
2485000 |
2485000 |
2485000 |
2485000 |
| Depreciation |
500000 |
500000 |
500000 |
500000 |
| Working Capital |
|
|
|
800000 |
| Residual Value |
|
|
|
500000 |
| Free Cash Flows |
2985000 |
2985000 |
2985000 |
4285000 |
| Discounted Value |
0.892857143 |
0.79719 |
0.71178 |
0.63552 |
| Discounted Inflows |
2665178.571 |
2379624 |
2124664 |
2723195 |
|
|
|
|
|
|
|
|
|
|
| Outflow |
$ 3,300,000.00 |
|
|
|
| Inflow |
9892661.302 |
|
|
|
| NRV |
$ 6,592,661.30 |
|
|
|
| Average selling price |
$ 20.00 |
|
|
|
| Expected sale |
450000 |
|
|
|
| equipment cost |
$ 2,500,000.00 |
|
|
|
| Residual Value |
$ 500,000.00 |
|
|
|
| Working Capital |
$ 800,000.00 |
|
|
|
| Depreciation |
SLM |
|
|
|
| Variable cost |
$ 15.00 |
|
|
|
| Fixed cost |
$ 450,000.00 |
|
|
|
| Discount rate |
12% |
|
|
|
| Tax Rate |
|
30% |
|
|
|
|
|
|
|
|
|
| Year |
|
1year |
2 year |
3 year |
4 year |
| Sales |
|
9000000 |
9000000 |
9000000 |
9000000 |
| Variable cost |
|
6750000 |
6750000 |
6750000 |
6750000 |
| Contribution |
|
2250000 |
2250000 |
2250000 |
2250000 |
| Fixed cost |
|
450000 |
450000 |
450000 |
450000 |
| Depreciation |
|
500000 |
500000 |
500000 |
500000 |
| Operating Profit |
|
1300000 |
1300000 |
1300000 |
1300000 |
| Tax |
|
390000 |
390000 |
390000 |
390000 |
| PAT |
|
910000 |
910000 |
910000 |
910000 |
| Depreciation |
|
500000 |
500000 |
500000 |
500000 |
| Working Capital |
|
|
|
|
800000 |
| Residual Value |
|
|
|
|
500000 |
| Free Cash Flows |
|
1410000 |
1410000 |
1410000 |
2710000 |
| Discounted Value |
|
0.892857143 |
0.79719 |
0.71178 |
0.63552 |
| Discounted Inflows |
|
1258928.571 |
1124043.367 |
1003610.149 |
1722254 |
|
|
|
|
|
|
|
|
|
|
|
|
| Outflow |
|
$ 3,300,000.00 |
|
|
|
| Inflow |
|
5108836.081 |
|
|
|
| NRV |
|
$ 1,808,836.08 |
|
|
|
|
|
|
|
|
|
|
|
|
|
|
|
|
|
|
|
|
|
|
|
|
|
|
|
| Average selling price |
$ 25.00 |
|
|
|
| Expected sale |
360000 |
|
|
|
| equipment cost |
$ 2,500,000.00 |
|
|
|
| Residual Value |
$ 500,000.00 |
|
|
|
| Working Capital |
$ 800,000.00 |
|
|
|
| Depreciation |
SLM |
|
|
|
| Variable cost |
$ 15.00 |
|
|
|
| Fixed cost |
$ 450,000.00 |
|
|
|
| Discount rate |
12% |
|
|
|
| Tax Rate |
|
30% |
|
|
|
|
|
|
|
|
|
| Year |
|
1year |
2 year |
3 year |
4 year |
| Sales |
|
9000000 |
9000000 |
9000000 |
9000000 |
| Variable cost |
|
5400000 |
5400000 |
5400000 |
5400000 |
| Contribution |
|
3600000 |
3600000 |
3600000 |
3600000 |
| Fixed cost |
|
360000 |
360000 |
360000 |
360000 |
| Depreciation |
|
500000 |
500000 |
500000 |
500000 |
| Operating Profit |
|
2740000 |
2740000 |
2740000 |
2740000 |
| Tax |
|
822000 |
822000 |
822000 |
822000 |
| PAT |
|
1918000 |
1918000 |
1918000 |
1918000 |
| Depreciation |
|
500000 |
500000 |
500000 |
500000 |
| Working Capital |
|
|
|
|
800000 |
| Residual Value |
|
|
|
|
500000 |
| Free Cash Flows |
|
2418000 |
2418000 |
2418000 |
3718000 |
| Discounted Value |
|
0.892857143 |
0.79719 |
0.71178 |
0.63552 |
| Discounted Inflows |
|
2158928.571 |
1927614.796 |
1721084.639 |
2362856 |
|
|
|
|
|
|
|
|
|
|
|
|
| Outflow |
|
$ 3,300,000.00 |
|
|
|
| Inflow |
|
8170484.222 |
|
|
|
| NRV |
|
$ 4,870,484.22 |
|
|
|
|
|
|
|
|
|
|
|
|
|
|
|
|
|
|
|
|
|
| Average selling price |
$ 25.00 |
|
|
|
| Expected sale |
450000 |
|
|
|
| equipment cost |
$ 2,500,000.00 |
|
|
|
| Residual Value |
$ 500,000.00 |
|
|
|
| Working Capital |
$ 800,000.00 |
|
|
|
| Depreciation |
SLM |
|
|
|
| Variable cost |
$ 29.80 |
|
|
|
| Fixed cost |
$ 450,000.00 |
|
|
|
| Discount rate |
12% |
|
|
|
| Tax Rate |
|
30% |
|
|
|
|
|
|
|
|
|
| Year |
|
1year |
2 year |
3 year |
4 year |
| Sales |
|
11250000 |
11250000 |
11250000 |
11250000 |
| Variable cost |
|
13410000 |
13410000 |
13410000 |
13410000 |
| Contribution |
|
-2160000 |
-2160000 |
-2160000 |
-2160000 |
| Fixed cost |
|
450000 |
450000 |
450000 |
450000 |
| Depreciation |
|
500000 |
500000 |
500000 |
500000 |
| Operating Profit |
|
-3110000 |
-3110000 |
-3110000 |
-3110000 |
| Tax |
|
-933000 |
-933000 |
-933000 |
-933000 |
| PAT |
|
-2177000 |
-2177000 |
-2177000 |
-2177000 |
| Depreciation |
|
500000 |
500000 |
500000 |
500000 |
| Working Capital |
|
|
|
|
800000 |
| Residual Value |
|
|
|
|
500000 |
| Free Cash Flows |
|
-1677000 |
-1677000 |
-1677000 |
-377000 |
| Discounted Value |
|
0.892857143 |
0.79719 |
0.71178 |
0.63552 |
| Discounted Inflows |
|
-1497321.429 |
-1336894.133 |
-1193655.476 |
-239590 |
|
|
|
|
|
|
|
|
|
|
|
|
| Outflow |
|
$ 3,300,000.00 |
|
|
|
| Inflow |
|
-4267461.352 |
|
|
|
| NRV |
|
$ (7,567,461.35) |
|
|
|
|
|
|
|
|
|
| Worst Case |
|
|
|
|
|
|
|
|
|
|
|
| Average selling price |
$ 25.00 |
|
|
|
| Expected sale |
450000 |
|
|
|
| equipment cost |
$ 2,500,000.00 |
|
|
|
| Residual Value |
$ 500,000.00 |
|
|
|
| Working Capital |
$ 800,000.00 |
|
|
|
| Depreciation |
SLM |
|
|
|
| Variable cost |
$ 15.00 |
|
|
|
| Fixed cost |
$ 550,000.00 |
|
|
|
| Discount rate |
12% |
|
|
|
| Tax Rate |
|
30% |
|
|
|
|
|
|
|
|
|
| Year |
|
1year |
2 year |
3 year |
4 year |
| Sales |
|
11250000 |
11250000 |
11250000 |
11250000 |
| Variable cost |
|
6750000 |
6750000 |
6750000 |
6750000 |
| Contribution |
|
4500000 |
4500000 |
4500000 |
4500000 |
| Fixed cost |
|
$ 550,000.00 |
$ 550,000.00 |
550000 |
550000 |
| Depreciation |
|
500000 |
500000 |
500000 |
500000 |
| Operating Profit |
|
3450000 |
3450000 |
3450000 |
3450000 |
| Tax |
|
1035000 |
1035000 |
1035000 |
1035000 |
| PAT |
|
2415000 |
2415000 |
2415000 |
2415000 |
| Depreciation |
|
500000 |
500000 |
500000 |
500000 |
| Working Capital |
|
|
|
|
800000 |
| Residual Value |
|
|
|
|
500000 |
| Free Cash Flows |
|
2915000 |
2915000 |
2915000 |
4215000 |
| Discounted Value |
|
0.892857143 |
0.79719 |
0.71178 |
0.63552 |
| Discounted Inflows |
|
2602678.571 |
2323820.153 |
2074839.422 |
2678709 |
|
|
|
|
|
|
| Sensitivity Analysis |
|
|
|
|
|
| Outflow |
|
$ 3,300,000.00 |
|
|
|
| Inflow |
|
9680046.847 |
|
|
|
| NRV |
|
$ 6,380,046.85 |
|
|
|
|
|
|
|
|
|
|
|
|
|
|
|
| Unit Drivers |
|
|
Expected NRV |
Revised NRV |
Change in % |
| Unit Sales (-20%) |
|
|
$ 6,592,661.30 |
$ 1,808,836.08 |
73% |
| Per Unit (-20%) |
|
|
$ 6,592,661.30 |
$ 4,870,484.22 |
26% |
| Variable Cost (+20%) |
|
|
$ 6,592,661.30 |
$ (7,567,461.35) |
215% |
| Cash Fixed Cost (+100000) |
|
|
$ 6,592,661.30 |
$ 6,380,046.85 |
3% |
Good Case
| Average selling price |
$ 30.00 |
|
|
|
| Expected sale |
450000 |
|
|
|
| equipment cost |
$ 2,500,000.00 |
|
|
|
| Residual Value |
$ 500,000.00 |
|
|
|
| Working Capital |
$ 800,000.00 |
|
|
|
| Depreciation |
SLM |
|
|
|
| Variable cost |
$ 15.00 |
|
|
|
| Fixed cost |
$ 450,000.00 |
|
|
|
| Discount rate |
12% |
|
|
|
| Tax Rate |
|
30% |
|
|
|
|
|
|
|
|
|
| Year |
|
1year |
2 year |
3 year |
4 year |
| Sales |
|
13500000 |
13500000 |
13500000 |
13500000 |
| Variable cost |
|
6750000 |
6750000 |
6750000 |
6750000 |
| Contribution |
|
6750000 |
6750000 |
6750000 |
6750000 |
| Fixed cost |
|
450000 |
450000 |
450000 |
450000 |
| Depreciation |
|
500000 |
500000 |
500000 |
500000 |
| Operating Profit |
|
5800000 |
5800000 |
5800000 |
5800000 |
| Tax |
|
1740000 |
1740000 |
1740000 |
1740000 |
| PAT |
|
4060000 |
4060000 |
4060000 |
4060000 |
| Depreciation |
|
500000 |
500000 |
500000 |
500000 |
| Working Capital |
|
|
|
|
800000 |
| Residual Value |
|
|
|
|
500000 |
| Free Cash Flows |
|
4560000 |
4560000 |
4560000 |
5860000 |
| Discounted Value |
|
0.892857143 |
0.79719 |
0.71178 |
0.63552 |
| Discounted Inflows |
|
4071428.571 |
3635204.082 |
3245717.93 |
3724136 |
|
|
|
|
|
|
|
|
|
|
|
|
| Outflow |
|
$ 3,300,000.00 |
|
|
|
| Inflow |
|
14676486.52 |
|
|
|
| NRV |
|
$ 11,376,486.52 |
|
|
|
|
|
|
|
|
|
|
|
|
|
|
|
|
|
|
|
|
|
|
|
|
|
|
|
| Average selling price |
$ 25.00 |
|
|
|
| Expected sale |
540000 |
|
|
|
| equipment cost |
$ 2,500,000.00 |
|
|
|
| Residual Value |
$ 500,000.00 |
|
|
|
| Working Capital |
$ 800,000.00 |
|
|
|
| Depreciation |
SLM |
|
|
|
| Variable cost |
$ 15.00 |
|
|
|
| Fixed cost |
$ 450,000.00 |
|
|
|
| Discount rate |
12% |
|
|
|
| Tax Rate |
|
30% |
|
|
|
|
|
|
|
|
|
| Year |
|
1year |
2 year |
3 year |
4 year |
| Sales |
|
13500000 |
13500000 |
13500000 |
13500000 |
| Variable cost |
|
8100000 |
8100000 |
8100000 |
8100000 |
| Contribution |
|
5400000 |
5400000 |
5400000 |
5400000 |
| Fixed cost |
|
540000 |
540000 |
540000 |
540000 |
| Depreciation |
|
500000 |
500000 |
500000 |
500000 |
| Operating Profit |
|
4360000 |
4360000 |
4360000 |
4360000 |
| Tax |
|
1308000 |
1308000 |
1308000 |
1308000 |
| PAT |
|
3052000 |
3052000 |
3052000 |
3052000 |
| Depreciation |
|
500000 |
500000 |
500000 |
500000 |
| Working Capital |
|
|
|
|
800000 |
| Residual Value |
|
|
|
|
500000 |
| Free Cash Flows |
|
3552000 |
3552000 |
3552000 |
4852000 |
| Discounted Value |
|
0.892857143 |
0.79719 |
0.71178 |
0.63552 |
| Discounted Inflows |
|
3171428.571 |
2831632.653 |
2528243.44 |
3083534 |
|
|
|
|
|
|
|
|
|
|
|
|
| Outflow |
|
$ 3,300,000.00 |
|
|
|
| Inflow |
|
11614838.38 |
|
|
|
| NRV |
|
$ 8,314,838.38 |
|
|
|
|
|
|
|
|
|
|
|
|
|
|
|
|
|
|
|
|
|
| Average selling price |
$ 25.00 |
|
|
|
| Expected sale |
450000 |
|
|
|
| equipment cost |
$ 2,500,000.00 |
|
|
|
| Residual Value |
$ 500,000.00 |
|
|
|
| Working Capital |
$ 800,000.00 |
|
|
|
| Depreciation |
SLM |
|
|
|
| Variable cost |
$ 12.00 |
|
|
|
| Fixed cost |
$ 450,000.00 |
|
|
|
| Discount rate |
12% |
|
|
|
| Tax Rate |
|
30% |
|
|
|
|
|
|
|
|
|
| Year |
|
1year |
2 year |
3 year |
4 year |
| Sales |
|
11250000 |
11250000 |
11250000 |
11250000 |
| Variable cost |
|
5400000 |
5400000 |
5400000 |
5400000 |
| Contribution |
|
5850000 |
5850000 |
5850000 |
5850000 |
| Fixed cost |
|
450000 |
450000 |
450000 |
450000 |
| Depreciation |
|
500000 |
500000 |
500000 |
500000 |
| Operating Profit |
|
4900000 |
4900000 |
4900000 |
4900000 |
| Tax |
|
1470000 |
1470000 |
1470000 |
1470000 |
| PAT |
|
3430000 |
3430000 |
3430000 |
3430000 |
| Depreciation |
|
500000 |
500000 |
500000 |
500000 |
| Working Capital |
|
|
|
|
800000 |
| Residual Value |
|
|
|
|
500000 |
| Free Cash Flows |
|
3930000 |
3930000 |
3930000 |
5230000 |
| Discounted Value |
|
0.892857143 |
0.79719 |
0.71178 |
0.63552 |
| Discounted Inflows |
|
3508928.571 |
3132971.939 |
2797296.374 |
3323760 |
|
|
|
|
|
|
|
|
|
|
|
|
| Outflow |
|
$ 3,300,000.00 |
|
|
|
| Inflow |
|
12762956.43 |
|
|
|
| NRV |
|
$ 9,462,956.43 |
|
|
|
|
|
|
|
|
|
|
|
|
|
|
|
|
|
|
|
|
|
| Average selling price |
$ 25.00 |
|
|
|
| Expected sale |
450000 |
|
|
|
| equipment cost |
$ 2,500,000.00 |
|
|
|
| Residual Value |
$ 500,000.00 |
|
|
|
| Working Capital |
$ 800,000.00 |
|
|
|
| Depreciation |
SLM |
|
|
|
| Variable cost |
$ 15.00 |
|
|
|
| Fixed cost |
$ 550,000.00 |
|
|
|
| Discount rate |
12% |
|
|
|
| Tax Rate |
|
30% |
|
|
|
|
|
|
|
|
|
| Year |
|
1year |
2 year |
3 year |
4 year |
| Sales |
|
11250000 |
11250000 |
11250000 |
11250000 |
| Variable cost |
|
6750000 |
6750000 |
6750000 |
6750000 |
| Contribution |
|
4500000 |
4500000 |
4500000 |
4500000 |
| Fixed cost |
|
$ 550,000.00 |
$ 550,000.00 |
550000 |
550000 |
| Depreciation |
|
500000 |
500000 |
500000 |
500000 |
| Operating Profit |
|
3450000 |
3450000 |
3450000 |
3450000 |
| Tax |
|
1035000 |
1035000 |
1035000 |
1035000 |
| PAT |
|
2415000 |
2415000 |
2415000 |
2415000 |
| Depreciation |
|
500000 |
500000 |
500000 |
500000 |
| Working Capital |
|
|
|
|
800000 |
| Residual Value |
|
|
|
|
500000 |
| Free Cash Flows |
|
2915000 |
2915000 |
2915000 |
4215000 |
| Discounted Value |
|
0.892857143 |
0.79719 |
0.71178 |
0.63552 |
| Discounted Inflows |
|
2602678.571 |
2323820.153 |
2074839.422 |
2678709 |
|
|
|
|
|
|
|
|
|
|
|
|
| Outflow |
|
$ 3,300,000.00 |
|
|
|
| Inflow |
|
9680046.847 |
|
|
|
| NRV |
|
$ 6,380,046.85 |
|
|
|
|
|
|
|
|
|
| Sensitivity Analysis |
|
|
|
|
|
| Unit Drivers |
|
|
Expected NRV |
Revised NRV |
Change in % |
| Unit Sales (-20%) |
|
|
$ 6,592,661.30 |
$ 11,376,486.52 |
-73% |
| Per Unit (-20%) |
|
|
$ 6,592,661.30 |
$ 8,314,838.38 |
-26% |
| Variable Cost (+20%) |
|
|
$ 6,592,661.30 |
$ 9,462,956.43 |
-44% |
| Cash Fixed Cost (+100000) |
|
|
$ 6,592,661.30 |
$ 6,380,046.85 |
3% |
2.5 Identify and discuss any latest share or bond issuance by the selected company
JB Hi Fi Company is officially listed on Australia Stock Exchange on 23/10/2003. The issuer code of the company is JBH. According to the rating companies risks are balanced. The shares applied in 2019 have been raised 50%. The stock price have been listed recently is ₹ 34.860 with the increase of Rs +0.520 and +1.51% has been raised according to the relevant sources referred by the JB HI FI company. The company’s trends changes and fluctuations takes place.
Jb Hi Fi Company has been operated as a listed holding company in Australia. The company consists of most popular and trusted retail brands of home appliances whether major appliances and small appliances, home entertainment appliances etc are operated mainly in Australia (Goldstein, et. al., 2017). These brands are JB HI-FI and The Good Guys. The Good Guys is the subsidiary company of JB HI-FI Company. The capital structure of the company can be analyzed by latest statistics referred from the Wall Street Journal.
- Total Debt to Total Equity has been checked as 42.06.
- Total Debt to Total Capital is seen as 29.60.
- Total Debt to Total Assets ratios has been got 17.23.
- Interest Coverage received as 31.78
- Long-Term Debt to Equity Ratio we got is as 42.06.
- Long-Term Debt to Total Capitalism 29.60.
- Long-Term Debt to Assets ratio by the company is 0.17.
2.6 Calculate and discuss the PE ratios and share price movement of the selected company through 3 years.
PE Ratio means the price earnings ratio. The company PE ratio will show the actual market position of the company (Becker & Ivashina, 2015).The Highest the PE ratio the highest the company valuation. The company use this as an important analytical tool for the investors. It will be calculates as
P/E Ratio = Earnings per share / Market value per share
The PE ratio of the year 2019 is 16.0. This will show that the company is having good financial position and will have good image in the market.
The following graph will show you the movement of the PE ratio in the last years
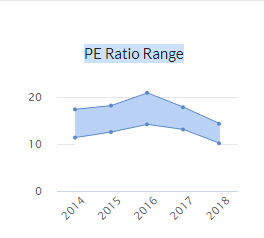
(Figure: PE ratio)
(Source: Stockpedia, 2019)
III Recommendation letter
It is recommended that the Jb Hi Fi Australian Company to all the investors as it follows all the basic and ethical behaviour and code of conduct necessary to follow by everyone. The directors, staff and employees expect all the guidelines are followed. As we have look upon the comprehensive examination and analysed the firm’s financial performance from the updated financial statements of JB Hi Fi Australia.
This time company is growing with the increasing trend. The only competitor in front of JBH is KGN that’s Kogan limited. This time the sales have been hiked 3.5% to 7.1% billion in 2019. In order to have safe and easy returns investors can invest in the company.
Being an investment analyst, it is recommended to all the investors to invest in the Jb Hi Fi.The Company is performing well in the year 2019 and can write many stories of success in the upcoming years. The share price fluctuations are normal of JB HI FI. Company is viable to pay the liquid liabilities.
After going through a quick replay of the above questions, PEratiooftheyear2019is16.0it is clear that company is having good financial position and have good image in the market.
IV Conclusions
JB Hi Fi Company is a progressive company. It has set a benchmark for all those who wish to invest in home appliances products such as electronic appliances whether major or small appliances belonging to the company under the name JB Hi Fi. According to the statistical analysis we can say that company shows the best work done in 2019. We came to know about all the details of the company, because we studied the entire financial situation thoroughly.
The data has been researched and finalized with an accurate analysis of its condition, leading to the conclusion that JB Hi Fi has a strong position in Australia. In 2018, the price to income ratio was 18 xs. The higher the price to income ratio, the more optimistic the buyer will be about the company’s future performance. A company can reduce the price to income ratio by purchasing debt and spending cash. If the price to income ratio increases then it is better to deal in other companies rather than Jb Hi Fi Australia company.
References
- Becker, B., & Ivashina, V. (2015). Reaching for yield in the bond market. The Journal of Finance, 70(5), 1863-1902.
- Goldstein, I., Jiang, H., & Ng, D. T. (2017). Investor flows and fragility in corporate bond funds. Journal of Financial Economics, 126(3), 592-613.
- Huo, B. (2012). The impact of supply chain integration on company performance: an organizational capability perspective. Supply Chain Management: An International Journal, 17(6), 596-610.
- JB HI FI GROUP. (2019). Reports. [Online]. JB HI FI GROUP. http://annualreports.com/HostedData/AnnualReportArchive/J/ASX_JBH_2017.pdf [Accessed on 20.09.2019].
- Stockpedia. (2019).PE ratio. [Online] Stockpedai. Available at https://investors.jbhifi.com.au/wp-content/uploads/2019/08/4E_FY19.pdf. [Accessed on 20.09.2019].
- Talari, S., Shafie-Khah, M., Siano, P., Loia, V., Tommasetti, A., & Catalão, J. (2017). A review of smart cities based on the internet of things concept. Energies, 10(4), 421.
- Tandon, K., & Malhotra, N. (2013). Determinants of stock prices: Empirical evidence from NSE 100 companies. International Journal of Research in Management & Technology (IJRMT), ISSN, 2249, 9563.
Abstract
Fortescue Metals Group Ltd (FMG) is an iron ore company situated mainly in Australia. It was founded in the year 2003. The company comes under the industry of Metals and Mining. Its headquarters is placed in Perth, Western Australia. Fortescue Metals Group Ltd (FMG) deals in Iron ore, Steel, Gold, Copper and Lithium. It is one of the largest iron ore producers. Mainly fourth largest producer of iron ore in wide world. Elizabeth Gaines works as a (CEO) in the Fortescue Metals Group Ltd and Andrew Forrest being a (Chairman) combines to become the major shareholder in the company. The Fortescue Metals Group Ltd has many subsidiaries work under it. The mine company holds 87000 km2 area. The location where it is situated is Christmas Creek Mine, Pilbara region, West Australia. The company is listed company on the ASX Australia stock exchange with all well known companies. Fortescue Metals Group Ltd (FMG) has grown fastest heavy haul railways, advanced infrastructure and Fortescue company has its own iron ore carriers as well. Fortescue Metals Group Ltd is building a new succes story in the field of mining. Safety, values and empowerment of people are the basic goals, this Australian company holds.
I. Introduction :
The company selected is the fourth largest iron ore producer Fortescue Metals Group Ltd (FMG). The main purpose of my assignment is to research thoroughly through the Fortescue Metals Group Ltd. This purpose is carried so that we can learn about the success policies, financial performance and income statements of the above mentioned company. In this assignment, we will examine the main issues, underlying theories, performance measures used and the firm’s financial performance. We will get to know the capital structure, price earning ratios, non current assets and income statement.
The analyse of Fortescue Metals Group Ltd trends in the last three years. The company’s performance analysis and success report. The company’s philosophies and methodologies about future.
The companies financial ratios show many ups and downs from the last two to three years. The annual reports has been taken from the Fortescue Metals Group Ltd (FMG) official website https://www.fmgl.com.au/. The annual reports will show the progressive approach company took and the successful strategies taken. The assignment has been structured strictly as per the norms and guidelines suggested and the assigned tasks.
This assignment consists the real figures as per the Fortescue Metals Group Ltd website. The referred materials are latest and updated in the year 2019. The assignment consists of many useful information about the success, ups and downs, weaknesses and strengths. Here we will find out the details about the position and liquidity of Fortescue Metals Group Ltd. The share prices are checked on www.asx.com.au.
Financial analysis of fortescue metals group ltd. :
II. Financial Analysis of Selected Company
2.1 The Fortescue Metals Group Ltd company deals in mine industry mainly iron ore –
The Fortescue Metals Group Ltd company deals in Steel, Gold, Copper and Lithium but mainly iron ore. It offers the iron ore to world wide. The importance of the mining in maintaining the comparative advantages of the company can be listed below –
- Trained workers
- Flexible arrangements of work
- Staff incentives plan
- 16 – weeks paid parental leave etc
- Huge Mining sites
- Full check on the safety measures for any miss happenings occur at the time of work.
- Highly automated plants and machinery
All the other personal as well as professional benefits the Fortescue Metals Group Ltd provide to their staff and workers (Babalola & Abiola, 2013).
2.2 Calculation and analysis of performance of Fortescue Metals Group Ltd by liquidity ratios –
According to the data collected from THE WALL STREET JOURNAL, the financial data obtained from current financial statements of Fortescue Metals Group Ltd for the past 3 years we will calculate the liquidity ratios know about the capital structure (Fortescue metals group ltd., 2019).
Assets
| S.No, |
|
Particulars |
2016—17 |
|
2017-18 |
|
2018-19 |
|
| 1 |
Current |
|
|
|
|
|
|
|
| |
|
Current Assets |
$ 222,331.00 |
2.172304295 |
$ 470,047.00 |
2.930668562 |
626006 |
3.047904221 |
| |
|
Current Liabilities |
$ 102,348.00 |
$ 160,389.00 |
205389 |
|
| 2 |
Quick |
|
|
|
|
|
|
|
| |
|
Cash + Accts. Rec. |
$ 193,894.00 |
1.894458123 |
$ 405,946.00 |
2.531008984 |
517553 |
2.519867179 |
| |
|
Current Liabilities |
$ 102,348.00 |
$ 160,389.00 |
205389 |
|
| 3 |
Debt-to-Worth |
|
|
|
|
|
|
|
| |
|
Total Liabilities |
$ 102,448.00 |
0.424246942 |
$ 166,869.00 |
0.300281262 |
205616 |
0.260982365 |
| |
|
Net Worth |
$ 241,482.00 |
$ 555,709.00 |
787854 |
|
| |
|
|
|
|
|
|
|
|
| INCOME STATEMENT RATIOS: Profitability (Earning Power) |
|
|
|
|
|
|
|
|
| 4 |
Gross Margin |
|
|
|
|
|
|
|
| |
|
Gross Profit |
$ 151,006.00 |
0.274932772 |
$ 464,349.00 |
0.503439027 |
713752 |
0.53251722 |
| |
|
Sales |
$ 549,247.00 |
$ 922,354.00 |
1340336 |
|
| 5 |
Net Margin |
|
|
|
|
|
|
|
| |
|
Net Profit Before Tax |
$ 52,299.00 |
0.095219455 |
$ 415,711.00 |
0.450706562 |
283232 |
0.211314178 |
| |
|
Sales |
$ 549,247.00 |
$ 922,354.00 |
1340336 |
|
| |
|
|
|
|
|
|
|
|
| ASSET MANAGEMENT RATIOS: Overall Efficiency Ratios |
|
|
|
|
|
|
|
|
| 6 |
Sales-to-Assets |
|
|
|
|
|
|
|
| |
|
Sales |
$ 549,247.00 |
1.596973221 |
$ 922,354.00 |
1.276476726 |
1340336 |
1.349145923 |
| |
|
Total Assets |
$ 343,930.00 |
$ 722,578.00 |
993470 |
|
| 7 |
Return on Assets |
|
|
|
|
|
|
|
| |
|
Net Profit Before Tax |
$ 52,299.00 |
0.15206292 |
$ 415,711.00 |
0.575316436 |
283232 |
0.285093662 |
| |
|
Total Assets |
$ 343,930.00 |
$ 722,578.00 |
993470 |
|
| 8 |
Return on Investment |
|
|
|
|
|
|
|
| |
|
Net Profit Before Tax |
$ 52,299.00 |
0.15206292 |
$ 415,711.00 |
0.575316436 |
283232 |
0.285093662 |
| |
|
Net Worth |
$ 343,930.00 |
$ 722,578.00 |
993470 |
|
| |
|
|
|
|
|
|
|
|
| ASSET MANAGEMENT RATIOS: Working Capital Cycle Ratios |
|
|
|
|
|
|
|
|
| 9 |
Inventory Turnover |
|
|
|
|
|
|
|
| |
|
Cost of Goods Sold |
$ (285,729.00) |
-10.04778985 |
$ (458,005.00) |
-7.145052339 |
-590584 |
-5.4455294 |
| |
|
Inventory |
$ 28,437.00 |
$ 64,101.00 |
108453 |
|
| 10 |
Inventory Turn-Days |
|
|
|
|
|
|
|
| |
|
360 |
360 |
0.012659563 |
360 |
0.005616137 |
360 |
0.00331941 |
| |
|
Inventory Turnover |
$ 28,437.00 |
$ 64,101.00 |
108453 |
|
| 11 |
Accounts Receivable Turnover |
|
|
|
|
|
|
|
| |
|
Sales |
$ 549,247.00 |
7.536940473 |
$ 922,354.00 |
14.08367562 |
1340336 |
25.41017669 |
| |
|
Accounts Receivable |
$ 72,874.00 |
$ 65,491.00 |
52748 |
|
Commnets
- the current ratio has increased . This means the Fortescue Metals Group Ltd company is able to meet the short term liabilities successfully over the time. There is an increasing trend in the ratios.
- According to the above calculation, it is clear that with the increase in quick ratio Fortescue company can easily pay back its current liabilities. In 2018 the quick ratio was less than 1, this means company was not able to pay back the current liability.
- There is a certain growth in the cash ratio from the year 2017 to year 2019. But these ratios are less than 1. A ratio above 1 means that, the company can easily pay off its current liabilities with the cash and cash equivalent. Here the company have cash ratio less than 1 in all the years.
- According to the above scenario, the Debt Equity Ratio is changing but very minutely. The low Debt Equity Ratio indicates less of borrowed funds and more of owner funds in the company. So here it is a good sign. There is a decreasing trend in the Debt Equity Ratio in passing years (Blum & Dacorogna, 2014).
- As we can see there is a slight decline in the Debt to Total Asset Ratio in all the three years. This can be interpreted as the percentage of assets is funded through borrowing funds as compared with the percentage of principal resources that are funded by investors.
- As we can see from the above proprietary ratios in percentage. here. When proprietary ratios is high that means the company is financially strong. Here it seems the company is dependent on debts in 2017 and 2019. The trend is not regular (Fortescue metals group ltd., 2019).
- Above are the position of liquidity, solvency and trends analysis according to the important accounting ratios of Fortescue Metals Group Ltd.
2.3 Non-current Asset Analysis –
Non Current Assets are Fixed Assets such as Property, Plant, Equipment, Land & Building, Long-term Investment in Bonds and Stocks, Goodwill, Patents, Trademark etc.
| Carrying Amount beg. of the year |
2016-17 |
2017-18 |
2018-19 |
| Plant and equipment |
11456 |
11156 |
10995 |
| Land and buildings |
849 |
796 |
744 |
| Exploration and evaluation |
772 |
813 |
857 |
| Assets under development |
227 |
291 |
301 |
| Development |
3563 |
3437 |
3292 |
| Depreciation |
|
|
|
| Plant and equipment |
4521 |
5478 |
6464 |
| Land and buildings |
257 |
316 |
412 |
| Exploration and evaluation |
0 |
0 |
0 |
| Assets under development |
0 |
0 |
0 |
| Development |
1052 |
1259 |
1448 |
| Carrying Amount end of the year |
|
|
|
| Plant and equipment |
11156 |
10995 |
10690 |
| Land and buildings |
796 |
744 |
650 |
| Exploration and evaluation |
813 |
857 |
539 |
| Assets under development |
291 |
301 |
889 |
| Development |
3437 |
3292 |
3303 |
Here, in the year 2019 the amount of non-current assets has increased as compared to the last two years that is 2018 and 2017. This increase means the Fortescue Metals Group Ltd company can turn their assets in to cash within 1 year as per the date mentioned in companies balance sheet (Fortescue metals group ltd., 2019).
2.4 The scenario analysis as per the information given –
| Averag Price |
$25 |
|
|
|
|
| Units to be sold |
450000 |
|
|
|
|
| Life |
4 years |
|
|
|
|
| Equipmnet Cost |
$2,500,000 |
|
|
|
|
| Residual Value |
$500,000 |
|
|
|
|
| Working Cpaital |
$800,000 |
|
|
|
|
| Variable Cost |
$15 |
|
|
|
|
|
|
|
|
|
|
|
|
|
|
|
|
| NPV |
Current Case |
|
|
|
| Years |
0 |
1 |
2 |
3 |
4 |
| Equipmet Cost |
2500000 |
|
|
|
|
| Sales |
|
11250000 |
11250000 |
11250000 |
11250000 |
| Working Capital |
|
$800,000 |
800000 |
800000 |
800000 |
| Variable Cost |
|
6750000 |
6750000 |
6750000 |
6750000 |
| Residaul Value |
|
|
|
|
$500,000 |
| Cash Fixed Cost |
|
450000 |
450000 |
450000 |
$450,000 |
| Profit Before Tax |
|
$3,250,000 |
$3,250,000 |
$3,250,000 |
$3,250,000 |
| Tax |
|
975000 |
975000 |
975000 |
975000 |
| Profit after Tax |
|
$2,275,000 |
$2,275,000 |
$2,275,000 |
$2,275,000 |
| Discounted Values |
1 |
0.89285714 |
0.79719 |
0.71178 |
0.63552 |
| Discounted Cash Flow |
2500000 |
$2,031,250 |
$1,813,616 |
$1,619,300 |
$1,445,804 |
|
|
|
|
|
|
| Outflow |
2500000 |
|
|
|
|
| Inflow |
6909969.76 |
|
|
|
|
| Net Present Value |
4409969.76 |
|
|
|
|
| Averag Price |
$20 |
|
|
|
|
| Units to be sold |
360000 |
|
|
|
|
| Life |
4 years |
|
|
|
|
| Equipmnet Cost |
$2,500,000 |
|
|
|
|
| Residual Value |
$500,000 |
|
|
|
|
| Working Cpaital |
$800,000 |
|
|
|
|
| Variable Cost |
$18 |
|
|
|
|
|
|
|
|
|
|
|
|
|
|
|
|
| NPV |
Worst Case |
|
|
|
|
| Years |
0 |
1 |
2 |
3 |
4 |
| Equipmet Cost |
2500000 |
|
|
|
|
| Sales |
|
7200000 |
7200000 |
7200000 |
7200000 |
| Working Capital |
|
$800,000 |
800000 |
800000 |
800000 |
| Variable Cost |
|
6480000 |
6480000 |
6480000 |
6480000 |
| Residaul Value |
|
|
|
|
$500,000 |
| Cash Fixed Cost |
|
550000 |
550000 |
550000 |
$550,000 |
| Profit Before Tax |
|
($630,000) |
($630,000) |
($630,000) |
($630,000) |
| Tax |
|
-189000 |
-189000 |
-189000 |
-189000 |
| Profit after Tax |
|
($441,000) |
($441,000) |
($441,000) |
($441,000) |
| Discounted Values |
1 |
0.892857143 |
0.79719 |
0.71178 |
0.63552 |
| Discounted Cash Flow |
2500000 |
($393,750) |
($351,563) |
($313,895) |
($280,263) |
|
|
|
|
|
|
| Outflow |
2500000 |
|
|
|
|
| Inflow |
-1339471.06 |
|
|
|
|
| Net Present Value |
-3839471.06 |
|
|
|
|
| NPV |
Best Case |
|
|
|
|
| Years |
0 |
1 |
2 |
3 |
4 |
| Equipmet Cost |
2500000 |
|
|
|
|
| Sales |
|
16200000 |
16200000 |
16200000 |
16200000 |
| Working Capital |
|
$800,000 |
800000 |
800000 |
800000 |
| Variable Cost |
|
6480000 |
6480000 |
6480000 |
6480000 |
| Residaul Value |
|
|
|
|
$500,000 |
| Cash Fixed Cost |
|
350000 |
350000 |
350000 |
$350,000 |
| Profit Before Tax |
|
$8,570,000 |
$8,570,000 |
$8,570,000 |
$8,570,000 |
| Tax |
|
2571000 |
2571000 |
2571000 |
2571000 |
| Profit after Tax |
|
$5,999,000 |
$5,999,000 |
$5,999,000 |
$5,999,000 |
| Discounted Values |
1 |
0.892857143 |
0.79719 |
0.71178 |
0.63552 |
| Discounted Cash Flow |
2500000 |
$5,356,250 |
$4,782,366 |
$4,269,970 |
$3,812,473 |
|
|
|
|
|
|
| Outflow |
2500000 |
|
|
|
|
| Inflow |
18221058.73 |
|
|
|
|
| Net Present Value |
15721058.73 |
|
|
|
|
Interpretation on the sensitivity
Selling price : 9055951 = .19
450000*35*3.037
Variable Price = 9055951 = .44
450000*15*3.037
Fixed Cost = 9055951 = 6.63
450000*3.037
2.5 The latest share or bond issuance by the fortescue metals group ltd
The Fortescue Metals Group has issued coupon bonds recently. FMG Resources AUG 2006 is the issuer. The company has issued bonds in the form of Registered documentary bonds. It was an open subscription. It is an international bonds (Dorina, et. al., 2012).
The Company has been listing in Australia stock exchange as Fortescue FMG.
2.6 Calculation of the pe ratios and share price movement of the fortescue metals group ltd –
Price earning ratio has been declined to 46% last year in 2018. Up to the year 2019, the price earning ratio has gone up to 40%. The Operating income of the company is A$2.477 Billion in the year 2018 and the Net income results in A$1.134 billion in the year 2018 (Fortescue metals group ltd., 2019).
| Price Earning Ratios = Market price / Earning per share |
|
|
|
| |
2019 |
2018 |
2017 |
| Net income |
4456 |
1,134 |
2,775 |
| Earning pae share |
1.44 |
0.36 |
0.89 |
The present PE ratio of Fortescue Metals Group ltd is 22.5%. If the pe ratio is high, the company is a growth firm and vice versa (Babalola & Abiola, 2013).
The last recorded price of share of FMG was marked at 8.950. The share price movement is watched out as 0.185 2.11% .
Recommendation Letter –
As company took a comprehensive examination and analysed the firm’s financial performance from the updated financial statements of the Fortescue Metals Group Ltd. Being an investment analyst, I would recommend the investor to invest in Fortescue Metals Group Ltd. This company is performing well in the year 2019 and can write many success stories in the upcoming years. The share price fluctuations are not high or low. The investors can gain good returns from Fortescue Metals Group Ltd in near future.
Conclusion
The assignment is done with the fortescue metals group ltd .The company profit statement has been studied to find out the ratios of the company. This is finding that the company had making profits or not. The research will be useful to the shareholders to find whether to invest in the company or not. Thaw Company had made a successful issue of shares whose report had been summarised above. The ratios are done to better understanding of the report. All the current ration and the liquidity ratio are check to find the company had made profits in current year or not. The written down method of depreciation had been followed by the company. The life of the assets and the scarp value is as per the market value and as per the recommendation of law. The calculation of NPV is done to find pout whiter the project should be adopted or not. The company had made all the conclusion of worst and nest case and the sensitivity is done to find out which variable are more sensitive than others.
References
Babalola, Y. A., & Abiola, F. R. (2013). Financial ratio analysis of firms: A tool for decision making. International journal of management sciences, 1(4), 132-137.
Blum, P., & Dacorogna, M. (2014). DFA‐Dynamic Financial Analysis. Wiley StatsRef: Statistics Reference Online.
Christensen, T., Cottrell, D., & Baker, R. (2013). Advanced financial accounting. McGraw-Hill.
Dorina, P., Victoria, B., & Diana, B. (2012). Aspects of company performance analysis based on relevant financial information and nonfinancial information. The Annals of the University of Oradea, 956.
Fortescue metals group ltd. (2019). About us. [Online] Fortescue metals group ltd. Available at https://www.fmgl.com.au/docs/default-source/annual-reporting-suite/fy19-annual-report.pdf. [Accessed on 10.09.2019]
Fortescue metals group ltd. (2019). About us. [Online] Fortescue metals group ltd. Available at https://www.fmgl.com.au/docs/default-source/default-document-library/fy2017-annual-report.pdf [Accessed on 10.09.2019]
Fortescue metals group ltd. (2019). About us. [Online] Fortescue metals group ltd. Available at https://www.fmgl.com.au/investors/asx-announcements# [Accessed on 10.09.2019]